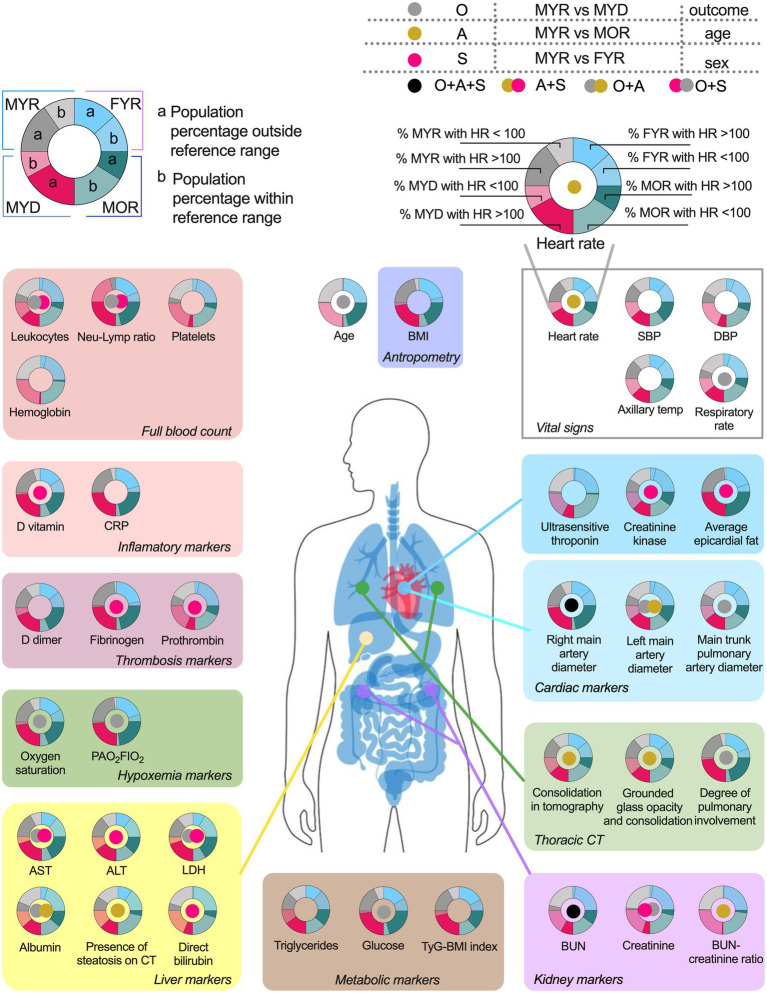
Figure 4.
Physiological variables differences and pathologic states prevalence among groups. The variables are grouped according to their usefulness as disorders alterations markers. The pie chart graphics show the behavior of the main study groups, the male young recovered (MYR) group is shown in the light blue pair, the female young recovered (FYR) group in the pink pair, the male old recovered (MOR) group in blue, and the male young deceased (MYD) group in gray. Each pair is made up of a solid shade (a) and a light shade (b). The solid tone (a) represents the population percentage with values outside the reference limits, while the light tone (b) represents the population percentage with values within the reference limits. The circle in the center indicates the statistically significant differences using Mann-Whitney U. Gray circle indicates a significant difference between the MYR and MYD groups (attributed to the outcome), gold circle indicates the difference between the MYR vs MOR groups (attributed to age), red circle indicates the difference between the MYR vs FYR groups (attributed to sex), while the black circle indicates the presence of statistically significant differences between all groups.

