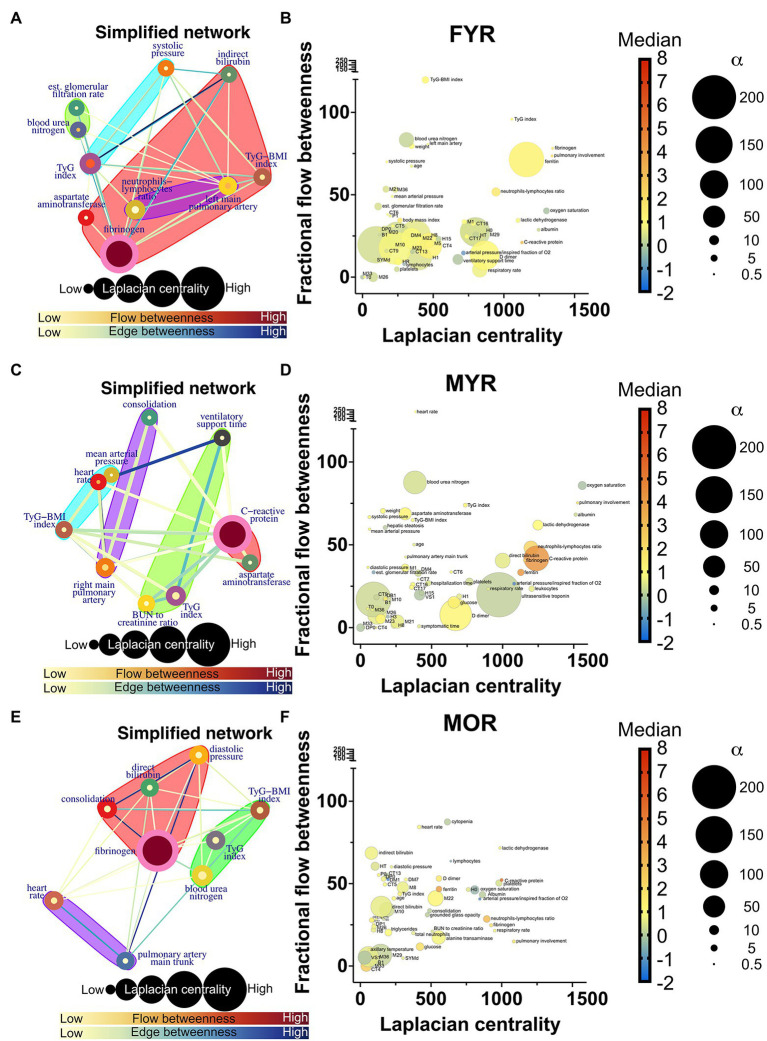
Figure 6.
Recovered networks. (A,C,E) Represents a simplified network in which supernodes are labeled with the name of the physiological variable with the greatest influence within the InfoMAP community. Edges were kept, resulting in a network with multiple edges. Edge betweenness is represented by the color of the edge. The flow betweenness centrality is represented by node color, and the Laplacian centrality is represented by node size. Clusters are represented by colored shaded areas. (B,D,F) The unmerged physiological variables’ Laplacian and fractional flow betweenness centralities were plotted. The color of the nodes represents the normalized median of each variable, whereas the size of the nodes represents the deviation from the normal distribution.

