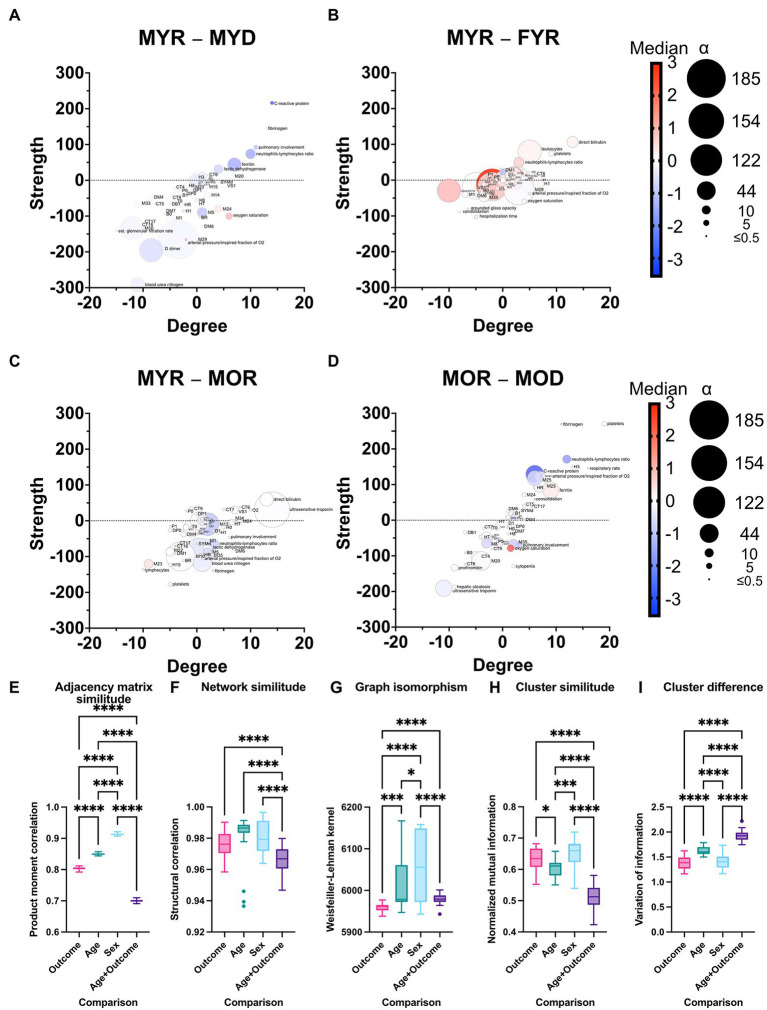
Figure 8.
Differences between physiological networks. The difference in node degree and strength against the reference network (MYR) is plotted for comparisons of outcome in young men (A), sex in young recovered patients (B), age in recovered men (C), and outcome in old men (D). The gradient of the normalized median value difference is shown in red to blue. The difference between the distributions is indicated by the size of the nodes. To compare the network structure to the reference, the product–moment correlation (D), structural correlation (F), and Weisfeiler-Lehman isomorphism tests (G) were used. Normalized mutual information (H) was used to quantify cluster similarity, while information variation was used to quantify cluster difference (I). Statistical difference is shown as for * p value <0.05, *** p value <0.001, and **** p value <0.0001.

