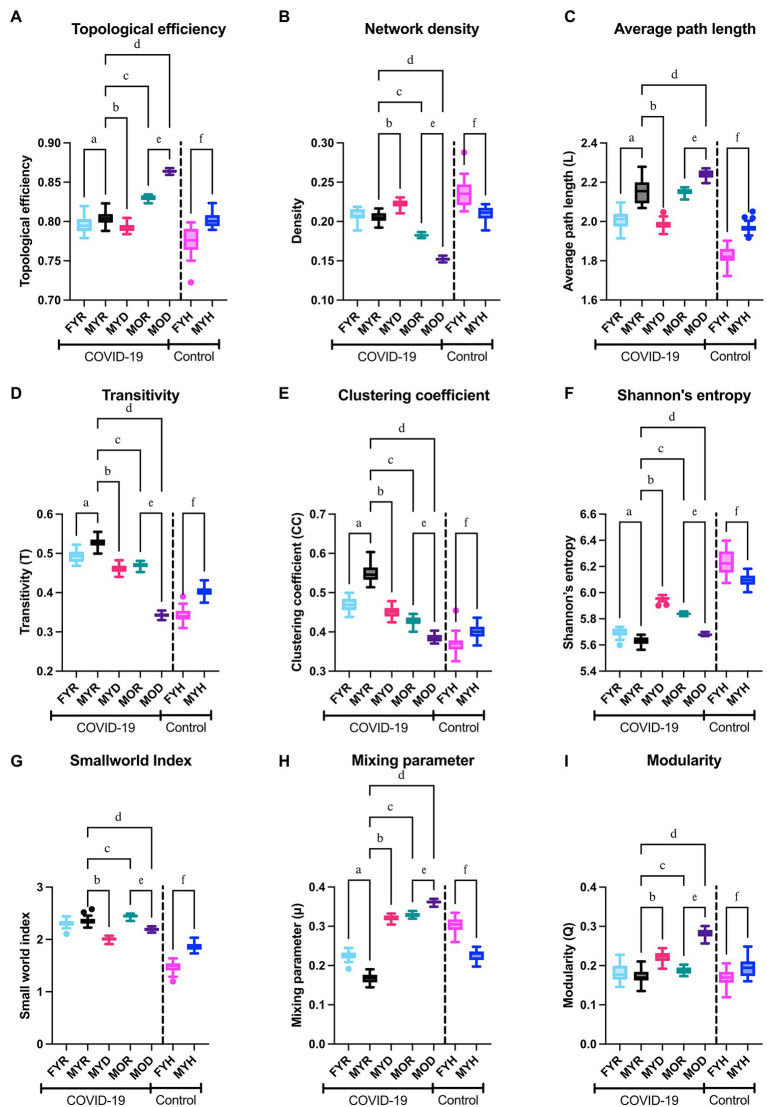
Figure 9.
Network topology. The topological efficiency (A), network density (B), average path length (C), transitivity (D), clustering coefficient (E), Shannon’s entropy (F), small world index (G), estimated mixing parameter (H), and modularity (I) of the networks from the study groups were compared to those of the reference group (MYR). To demonstrate the behavior of the networks in health conditions, male and female healthy control groups were compared in the columns placed right in each panel. Significant differences between groups MYR and FYR (a), MYD (b), MOR (c), MOD (d), between MOR and MOD (e) and between MYH and FYH (f).

