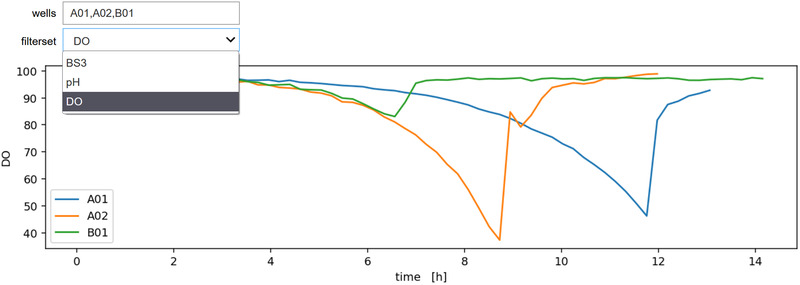
FIGURE 3.

Interactive plot of well‐wise measurements. A plot_custom function, defined in lines 1‐17 takes a comma‐separated text of well IDs and the name of a filterset as parameters for the visualization. In line 4 it iterates over the well IDs to create lines plots of the measurements, passing the number of the last relevant cycle from the event log (Table 1) to truncate the data. Line 21 passes the list of filtersets in the dataset (Code 3) as options for the fs keyword‐argument of the plotting function, thereby populating the dropdown menu
