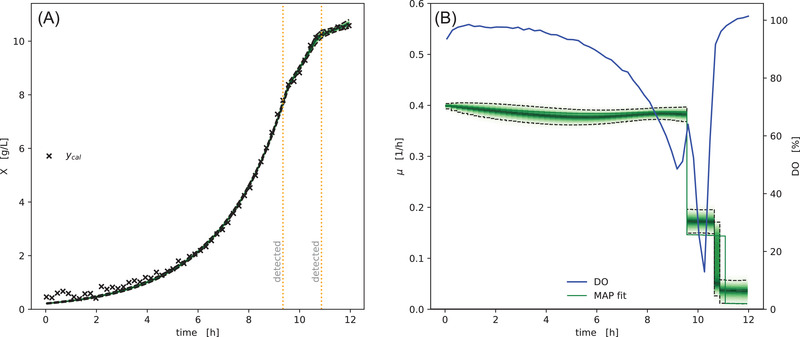
FIGURE 6.

Model prediction of variable growth rate. Biomass concentrations inferred from backscatter observations (A) are well explained by the drift of specific growth rate over time (B). At two timesteps the specific growth rate changed significantly, which resulted in the automatic detection of switchpoints (vertical dashed orange lines). These switchpoints in at 9.35 and 10.65 h coincide with changes in the Dissolved Oxygen (DO), indicating a change in cell metabolism. The green density bands visualize the posterior probability density, with dashed lines marking the 5 and 95% percentiles
