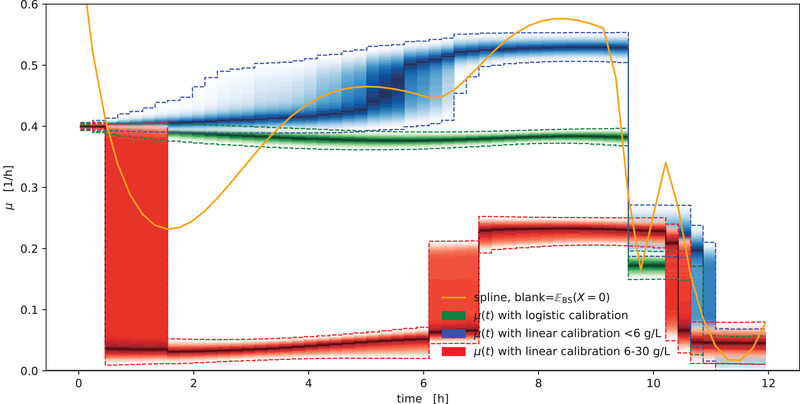
FIGURE 7.

Comparison of growth rate calculation methods. Spline‐based growth rate calculation based on blank subtraction (orange) yields a point estimate that fluctuates considerably compared to the “gold standard” of the generative method with detailed biomass/backscatter calibration (green). When the generative method is used with linear calibration models, the choice of calibration concentrations and the decision for (blue) or against (red) fixing the intercept at a blank backscatter has considerable effects on the quality of the outcome. The density bands visualize the posterior probability density, with dashed lines marking the 5 and 95 % percentiles
