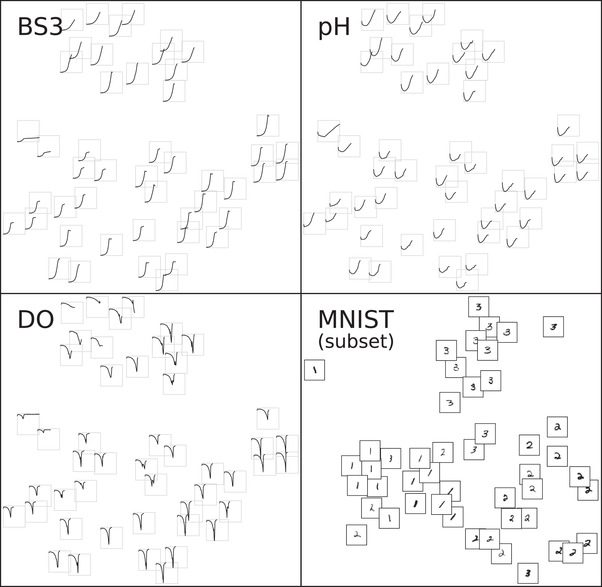
FIGURE 8.

t‐SNE from extracted time series features. Small tiles in subplots BS3, pH and DO correspond to culture wells and were arranged according to the t‐SNE result. The time series inside were truncated at the time of harvest. As with any t‐SNE visualization, the large‐scale arrangement, rotation or axis units are meaningless, since the technique prioritizes local structure. Note that tiles arranged in close proximity are have similar time series characteristics in all three filtersets. For comparison, a t‐SNE embedding of 48 random handwritten 1/2/3 digits from the MNIST dataset is shown in the lower right
