FIGURE 2.

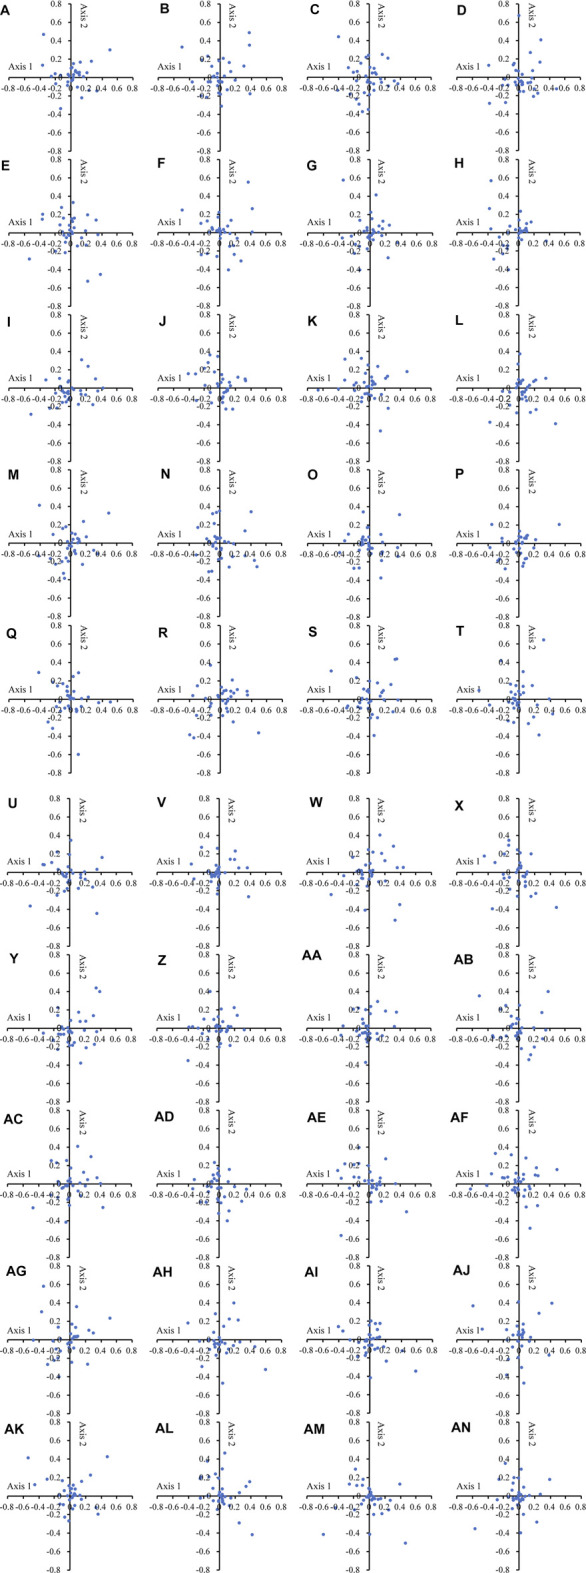
COA analysis of the chloroplast genomes in 40 Theaceae species. In all the Theaceae species, the dots of different genes are separated from each other in the figure. The numbers (A–AN) of the 40 species are shown in Table 1.

COA analysis of the chloroplast genomes in 40 Theaceae species. In all the Theaceae species, the dots of different genes are separated from each other in the figure. The numbers (A–AN) of the 40 species are shown in Table 1.