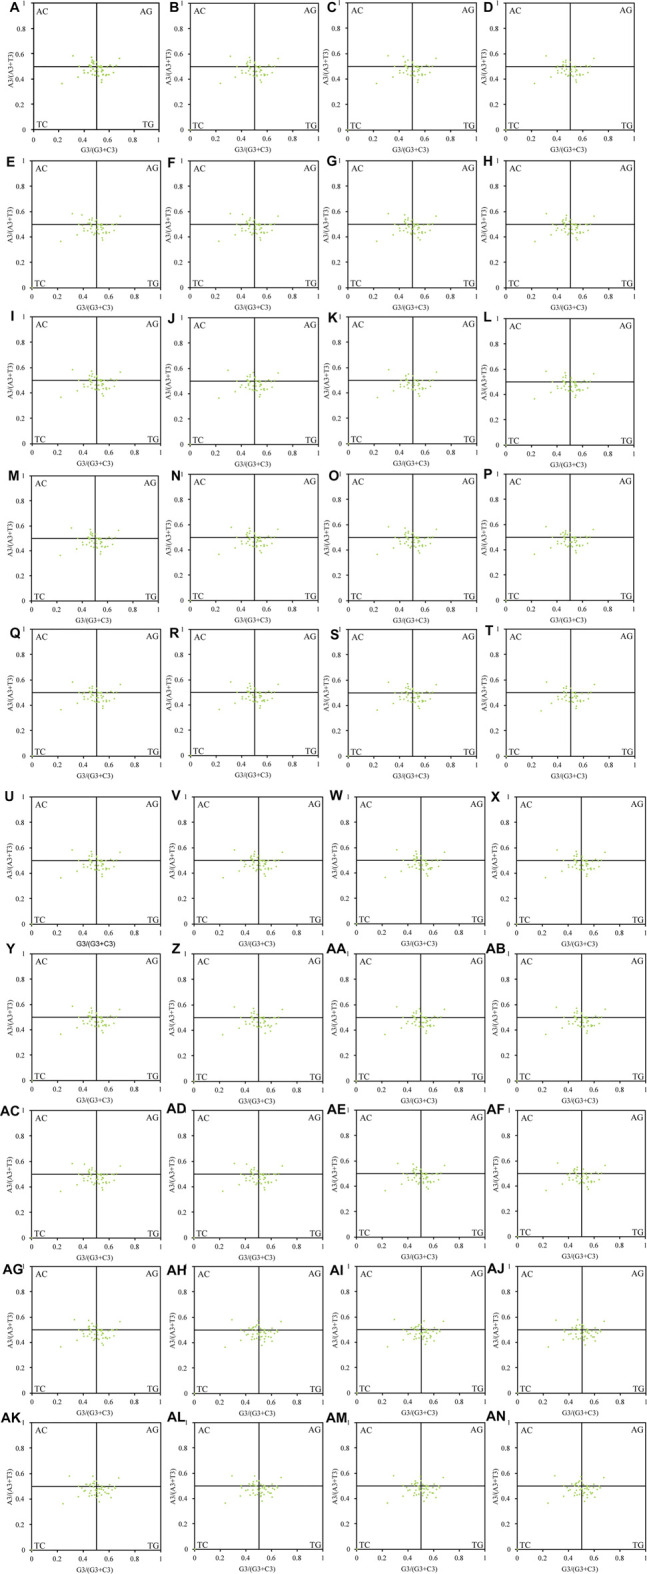
FIGURE 4.

PR2 plot of the chloroplast genomes in 40 Theaceae species. Points are randomly distributed in the four quadrants, and are mainly distributed in the regions of G3/(G3+C3) > 0.5 and A3/(A3+T3) < 0.5. The numbers (A–AN) of the 40 species are shown in Table 1.
