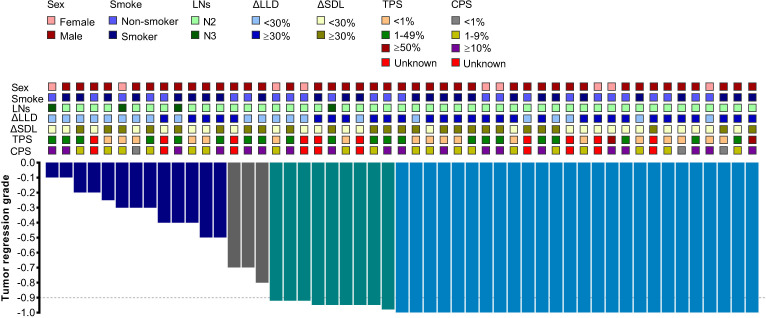
Figure 1.
Waterfall plot of pathological tumor regression in the per-protocol population (n=51). Each bar represents one patient. The upper column shows clinical characteristics and radiological responses. CPS, Combined Positive Score; LLD, lesion longest diameter; LN, lymph node; SDL, short diameter of the largest; TPS, Tumor Proportion Score.

