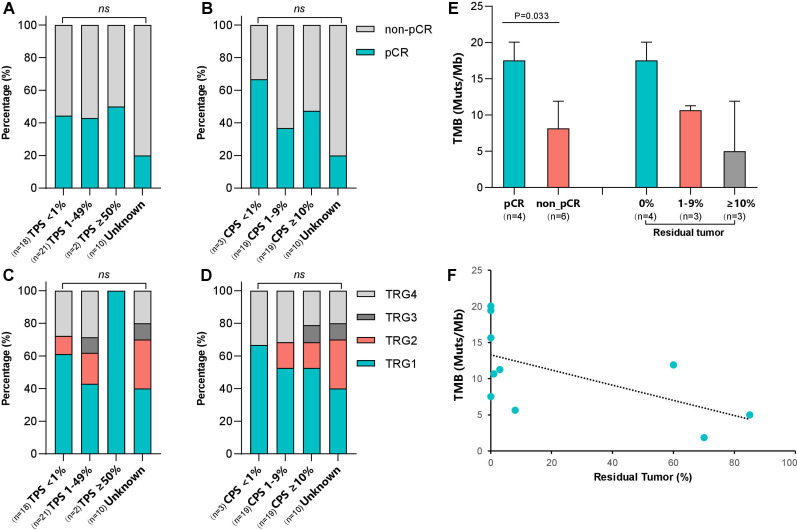
Figure 4.
Association between biomarkers and pathological regression. (A–D) PD-L1 scores and relationship to pathological regression. (E) Comparison of TMB between the PCR and non-pCR groups. (F) Distribution of TMB and the percentage of residual viable tumor cells. The dashed black line indicates the linear regression line. CPS, Combined Positive Score; PCR, pathologically complete response; TMB, tumor mutational burden; TPS, Tumor Proportion Score; TRG, tumor regression grade.

