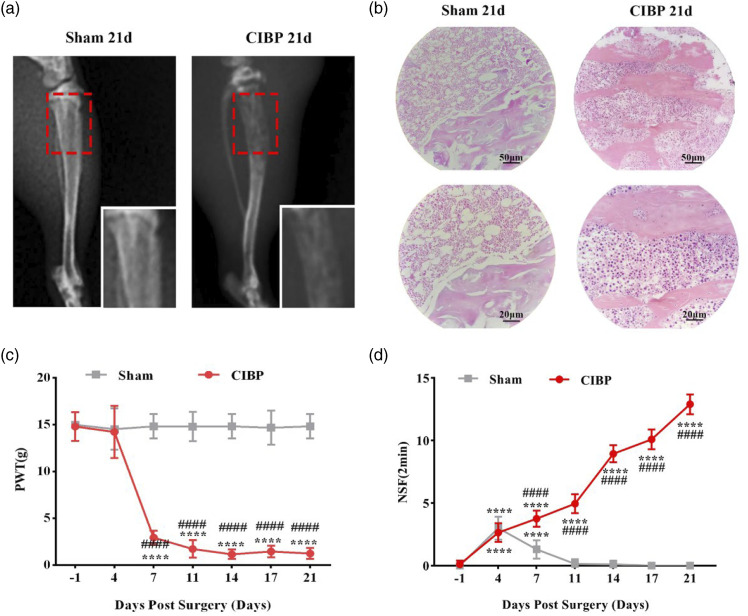
Figure 2.
The establishment of breast cancer-induced bone metastasis model in rats. (a) Radiographs of tibia 21 days after Walker 256 cells inoculation. The red frame circled the damage of the proximal cortical bone. (b) 21 days after cancer cells inoculation, hematoxylin-eosin (HE) staining of the proximal cortical bones. The bone marrow spaces are full of malignant tumor cells. (c) Paw withdrawal thresholds (PWTs) were examined on baseline (1 day before surgery) and postoperative days (POD) 4, 7, 11, 14, 17, 21. Data were presented as mean ± SD (n = 8 per group). ****p < .0001 versus baseline; ####p < .0001 versus Sham group. (d) Number of Spontaneous Flinches (NSF) was examined on baseline (1 day before surgery) and POD 4, 7, 11, 14, 17, and 21. Data were presented as mean ± SD (n = 8 per group). ****p < .0001 versus baseline; ####p < .0001 versus Sham group.

