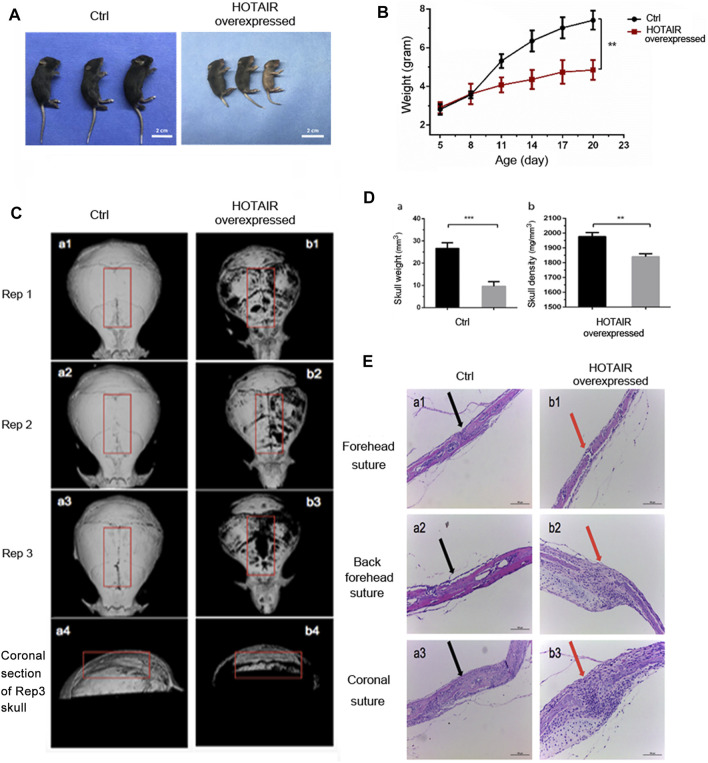
FIGURE 3.
The phenotype of HOTAIR in mouse model (A) The effect of HOTAIR on the physical development of C57 mice after 20 days’ birth (B) Quantitative assay of the mice weighted along the days after birth (C) Images of CT scan of the mouse skull (a1-a3 show the CT scan images of the isolated skulls of three replicates of 20-day-old WT mice, a4 shows the coronal section of a3 skull. b1-b3 shows the CT scan images of the isolated skulls of three replicates of 20-day-old HOTAIR overexpressed mice, b4 show the coronal section of the b3 skull) (D) Quantitative assay of the weight and bone density of mouse skull with CT scan (**p < 0.01, ***p < 0.001) (E) HE assays of the effect of overexpression of HOTAIR on the skull sutures in mice. Arrows point to the cranial sutures of mice. The scale of the images is 150 um.

