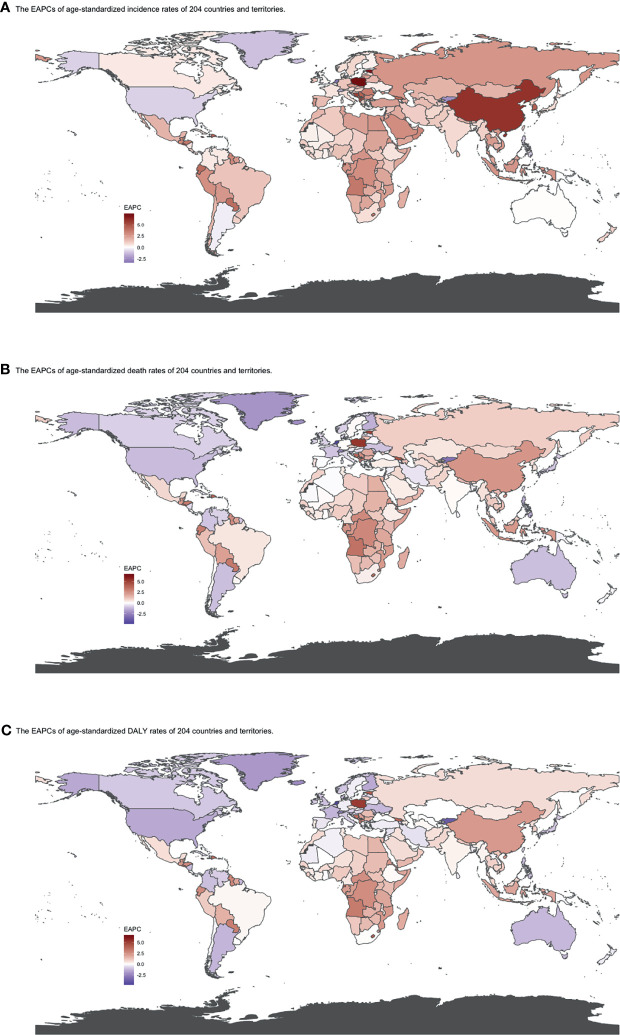
Figure 5.
EAPCs of (A) ASIR, (B) ASDRs, and (C) age-standardized DALY rates by country from 1990 to 2019. Heat gradient represents the change trends of EAPCs from red (highest) to blue (lowest). Blue indicates a downward trend and Red indicates an upward trend. (ASIR, age-standardized incidence rate; ASDR, age-standardized death rate; DALY, disability-adjusted life year; EAPC, estimated annual percentage change).

