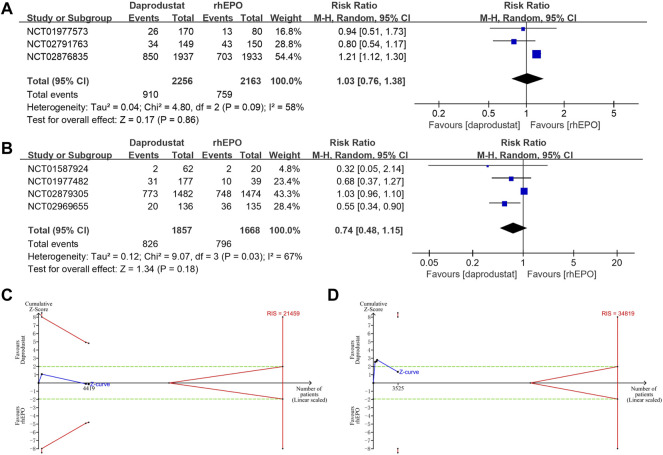
FIGURE 5.
The serious adverse events of daprodustat. (A) Forest plot of the serious adverse events of daprodustat and rhEPO in NDD-CKD patients. Notes: RR = 1.03, 95% CI = 0.76, 1.38, p = 0.86, I2 = 58%. (B) Forest plot of the serious adverse events of daprodustat and rhEPO in DD-CKD patients. Notes: RR = 0.74, 95% CI = 0.48, 1.15, p = 0.18, I2 = 67%. (C) Random effects model of the TSA of serious adverse events of daprodustat and rhEPO in NDD-CKD patients. A diversity-adjusted information size of 21459 participants was calculated based on an adverse event rate of 35.1% in the rhEPO group and a RR reduction of 20%, with α = 5% (two-sided), β = 20%, and I2 = 58%. The solid blue line represents the cumulative Z-curve, which did not cross the conventional boundary (dashed green line) and the trial sequential monitoring boundary (solid red line). (D) Random effects model of the TSA of serious adverse events of daprodustat and rhEPO in DD-CKD patients. A diversity-adjusted information size of 34819 participants was calculated based on an adverse event rate of 47.7% in the rhEPO group and a RR reduction of 20%, with α = 5% (two-sided), β = 20%, and I2 = 67%. The solid blue line represents the cumulative Z-curve, which did not cross the futility boundary (solid red line).

