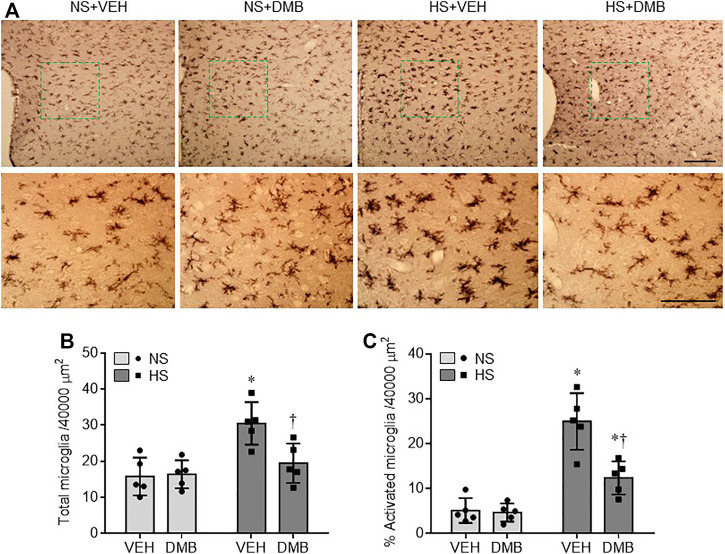
FIGURE 3.
Representative images of immunohistochemistry showing CD11b-immunoreactive microglia (A) and quantitative comparison of total (B) and activated (C) microglia in the PVN in rats fed a normal salt (NS) diet or a high salt (HS) diet and simultaneously treated with vehicle (VEH) or 1.0% 3,3-Dimethyl-1-butanol (DMB, an inhibitor of trimethylamine formation). Scale bar = 100 μm. All data are expressed as mean ± SEM (n = 5 rats/per group). ∗p < 0.05 vs. NS + VEH; †p < 0.05, HS + DMB vs. HS + VEH.

