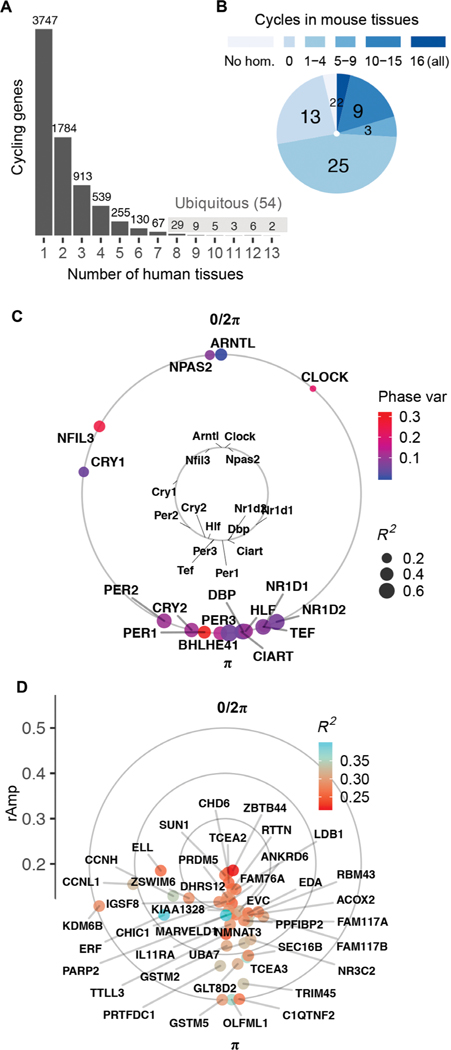
Fig. 1. Population-level rhythms in gene expression across human anatomy.
(A) Number of genes that met criteria for rhythmicity (FDR < 0.05; rAmp ≥ 0.1; R2 ≥ 0.1) in at least 1 of the 13 tissues. Periodic analysis was performed by cosinor regression on expression values for 160 CYCLOPS-ordered samples per tissue, as discussed in fig. S1 and Materials and Methods. See fig. S2 for numbers of rhythmic genes discovered at varying FDR thresholds. (B) Set of 54 ubiquitous genes cycling in at least 8 of 13 human tissues, grouped by prior circadian context as reported in CircaDB (darkest blue, homolog cycles in 16 of 16 mouse tissues; lightest blue, not cycling in any of the 16 mouse tissues). (C) Average acrophases of core clock genes (external circle) across all human tissues compared to mouse [internal circle, average across 12 tissues reported by Zhang et al. (3)]. Average coefficient of determination (R2, a measure of cycling robustness) is indicated by point size, and phase variability (Phase var) is indicated by color. Peak phase of ARNTL (human) or Arntl (mouse) was set as 0 for comparison. (D) Average acrophases of all other (noncore clock) human ubiquitous cycling genes. Genes located more distant from the center have larger average amplitudes of oscillation (rAmp) across tissues where they cycle.

