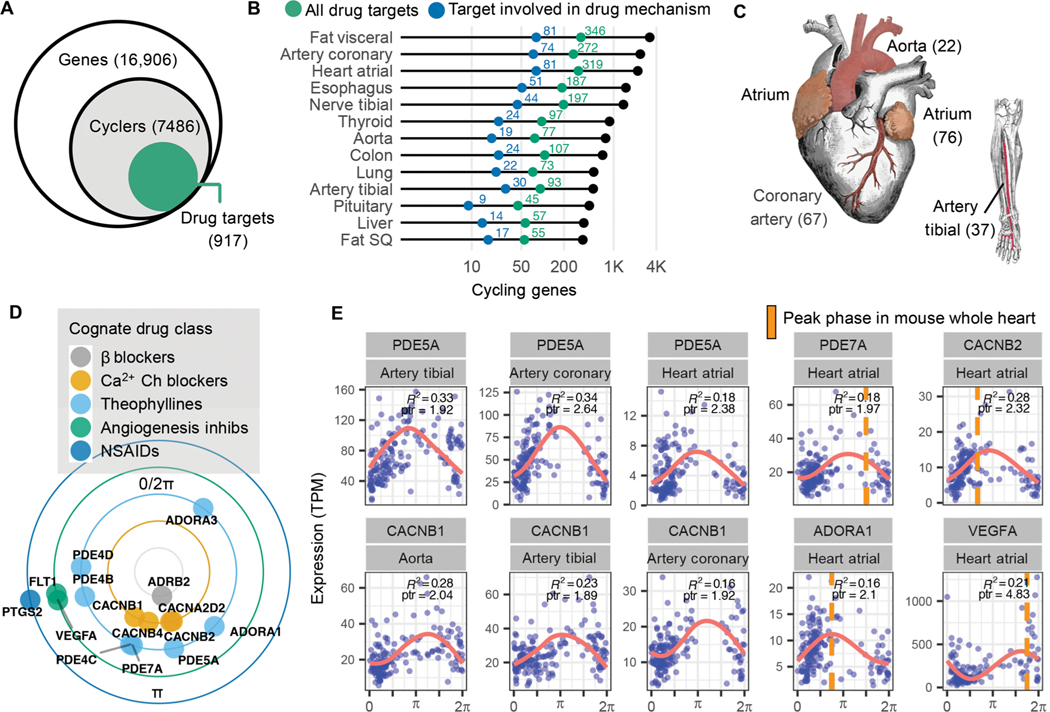
Fig. 3. Pharmacological links to molecular rhythms in the human population.
(A) Of 7486 genes found to cycle in at least 1 of 13 human tissues sampled, 917 (12%) encode at least one drug target, transporter, or metabolizing enzyme (collectively referred to as “targets”). This represents a total of 2764 drug entities, both approved and experimental as logged in DrugBank (20), with targets that oscillate somewhere in the body. (B) Numbers of total (colored green) and pharmacologically active (colored blue) cycling drug targets by tissue type. (C) Cardiovascular-related tissues from ordered GTEx data. To enrich for high-amplitude cardio-cyclers, we limited to genes in the upper 50th percentile for rAmp within each tissue and FDR ≤0.1. Numbers of cardio-cyclers that meet these cycling criteria and are also drug targets are indicated in parentheses. (D) Cardio-cyclers targeted by select drug classes relevant to heart and vessel physiology. Plotted phase represents average peak phase across all cardiac tissues where that gene was found to cycle. (E) Expression values plotted as a function of sample phase for select cardio-cyclers. Coefficient of determination (R2 ) and peak-to-trough ratio (ptr) are indicated. Right: Genes that are also rhythmically expressed in whole mouse heart, with peak phases indicated by orange bars. ARNTL (human) or Arntl (mouse) was set to 0 for comparison.

