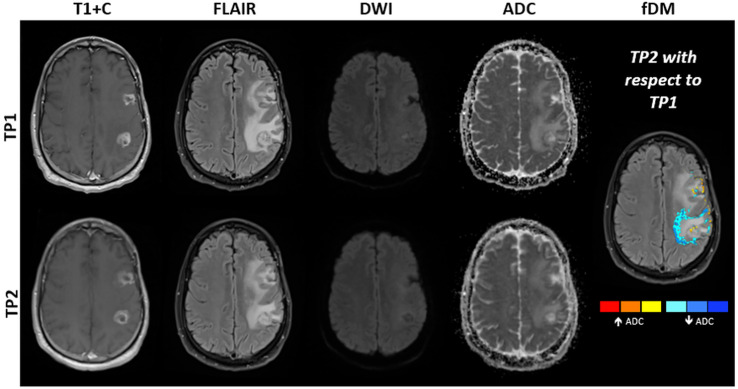
Figure 11.
MRI obtained in a 48-year-old patient with mulitfocal glioblastoma, IDH-wildtype. Shown are post-contrast T1-weighted images, FLAIR images, DWI at b = 1000 s/mm2 and ADC maps obtained at approximately two (TP1) and three months (TP2) after standard-of-care radiotherapy and concomittant temozolomide. Subtraction of ADC obtained at TP1 from ADC obtained at TP2 results in the creation of fDMs, which show where ADC is increasing (red to yellow) or decreasing (blue). Decreasing ADC (blue regions) is suggestive of increasing tumor cell density. Surgical resection performed one week after TP2 revealed an admixture of tumor recurrence and post-treatment related effects. Note that interpretation can be complicated by resolving edema between time points, which may also show decreased ADC.

