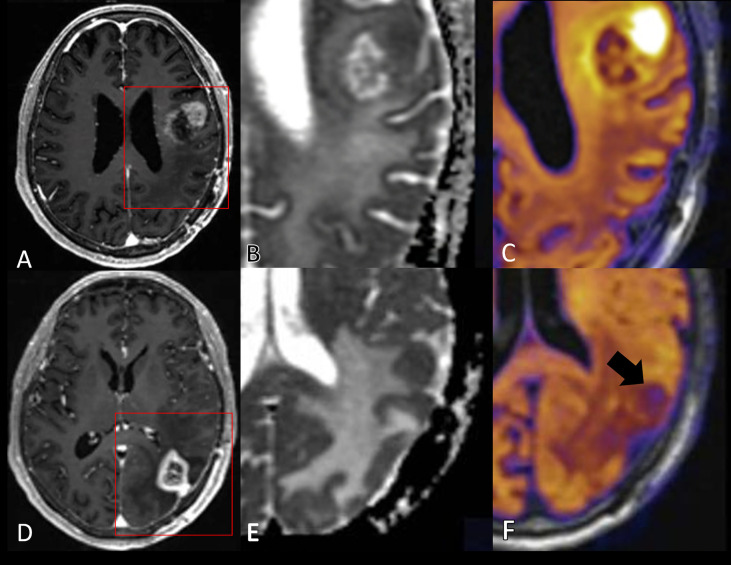
Figure 12.
A glioblastoma in a 64-year-old man after chemoradiation and immunotherapy with both true progression (A–C) and pseudoprogression (D–F) observed in the same patient at different time points. Red squares in the T1-weighted post contrast images (A, D) illustrate the magnified regions on ADC images (B, E) and RSI cellularity map (C, F). (A–C) An enhancing frontolateral area (A) confirmed to represent true progression is shown to have low ADC (B) with hyperintensity in the RSI cellularity map with more subtle ring hyperintensity around the central necrosis (C). Left parietal pseudoprogression in an enhancing solid focus (D) was shown to be hypointense on the RSI cellularity map (F). The ADC map is not decisive here (E). Adapted with kind permission by the authors (204).

