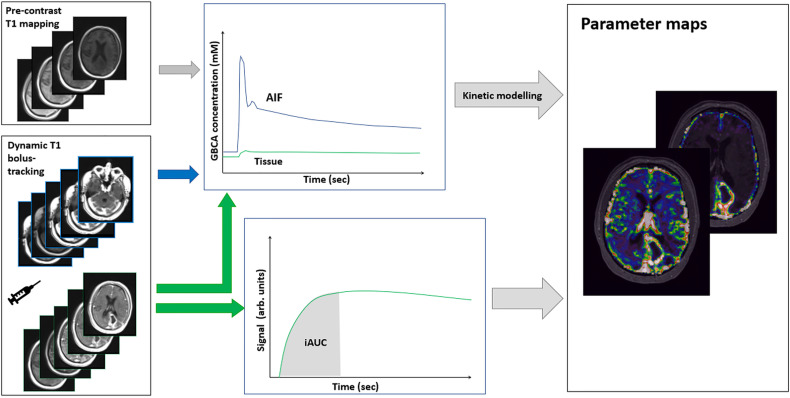
Figure 6.
Acquisition and processing of DCE-MRI data. Using dynamic T1-weighted imaging, a signal increase is measured during bolus passage. From the preceding T1 mapping obtained by T1-weighted imaging at variable flip angles, the signal change can be converted into absolute concentrations of GBCA. From time concentration curves in arterial blood (AIF) and in tissue, absolute parameter maps can be produced by subsequent kinetic modeling. A simplified relative measure can be obtained from the area under the iAUC (initial part of the tissue signal curve), which reflects a mixture of blood flow, permeability, and blood volume.

