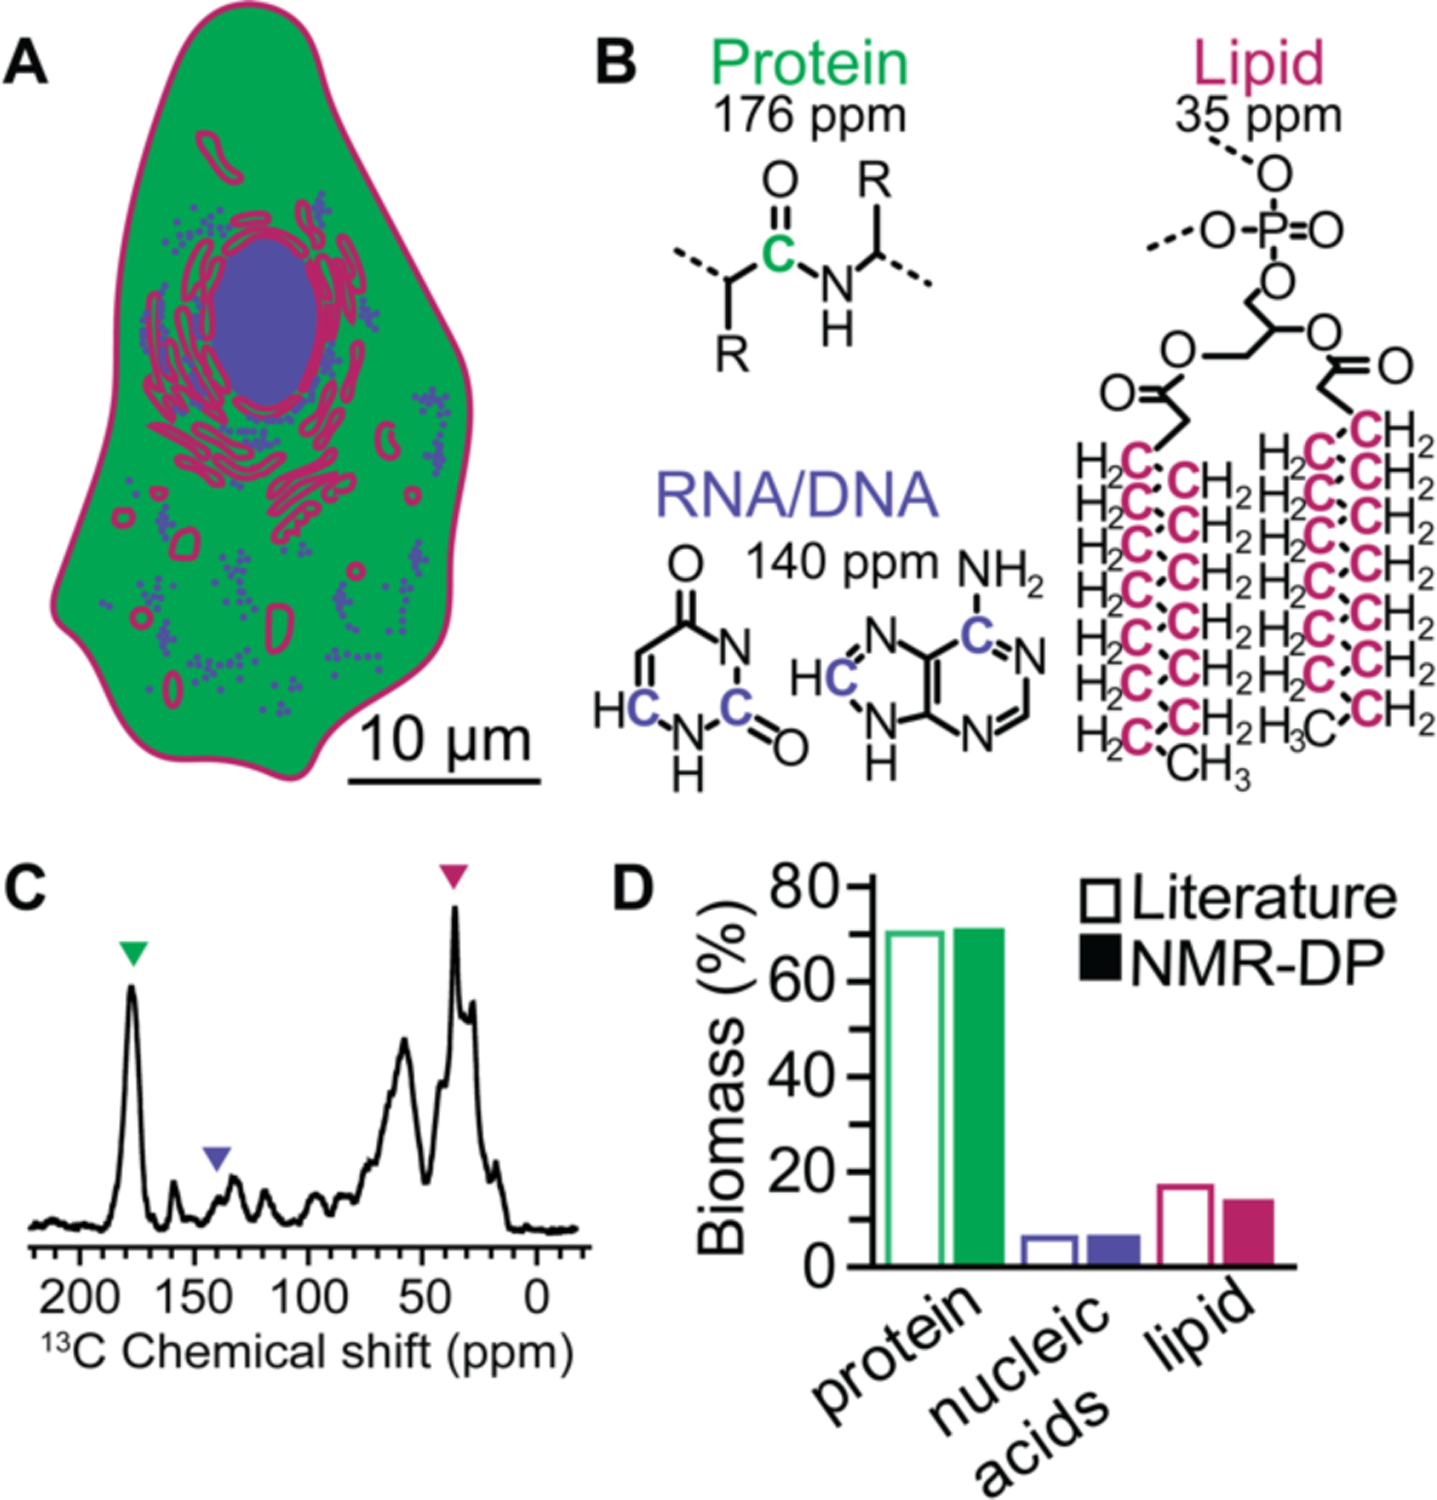
Figure 2:

NMR report quantitively on cellular biomass composition. (A) Schematic of a mammalian cell depicting the heterogenous distribution of the three major components of the cellular biomass: proteins (green) which are dispersed throughout the cell, nucleotides (blue) which are found in the RNA component of ribosomes in the cytoplasm and as DNA in the nucleus and lipids (pink) which are found in the plasma membrane and enclose all of the membrane bound organelles. (B) Structures of the biomass moieties with the representative carbon for each biomass component highlighted. (C) 13C direct polarization spectra of cryopreserved HEK293 cells grown on isotopically enriched media at 100 K taken at 600 MHz with 12 kHz magic angle spinning and a recycle delay of 300 seconds. Colored arrowheads indicate integrated peaks. (D) Quantification of biomass by NMR (closed bars) is similar to quantification of biomass by orthogonal methods47 (open bars).
