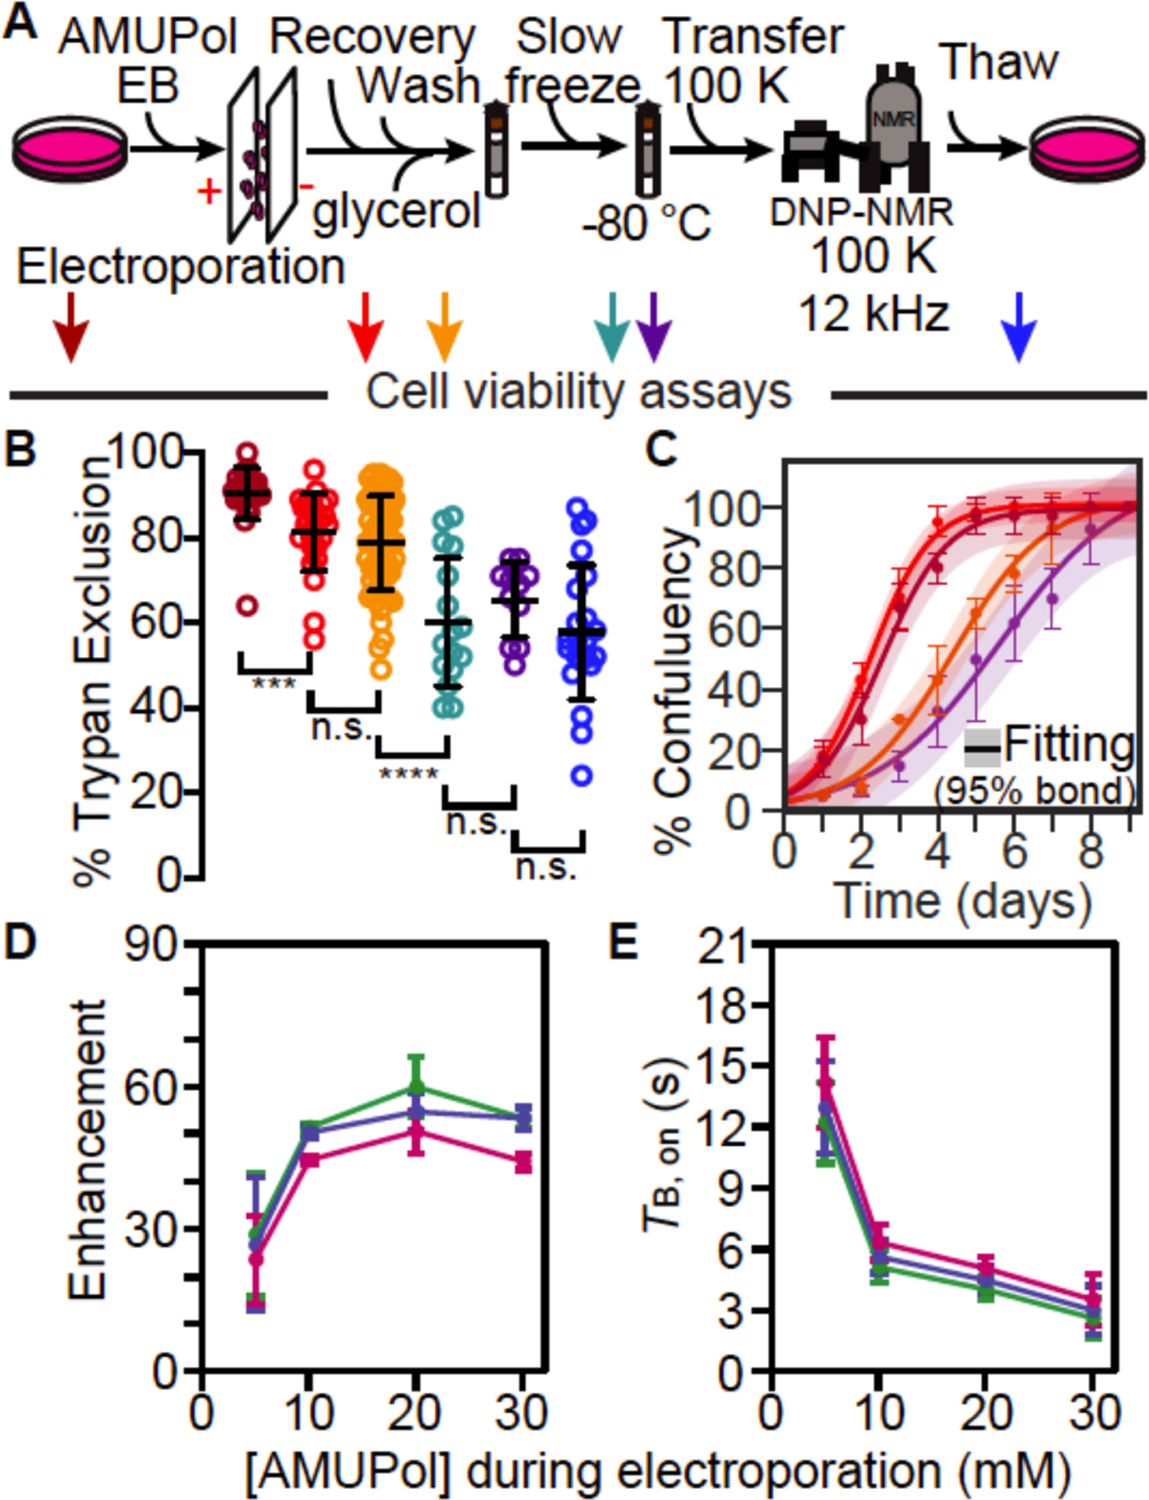
Figure 4:

Electroporated HEK293 cells remain viable throughout the DNP NMR process. (A) Experimental scheme of the DNP NMR sample preparation procedure that includes an electroporation step to introduce AMUPol into the sample. Colored arrows indicate points at which sample viability were assessed. Viability was assessed for cells after trypsinization and washing (dark red), after electroporation (red), after suspension in AMUPol and cryoprotectants (orange), upon thaw (green), upon thaw after manipulation to remove the drive tip from the rotor (purple) and upon thaw after DNP MAS NMR (blue). (B) Frozen cells best represent the state of the sample during DNP NMR data collection. Percentage of cells with trypan blue impermeable membranes at each sample assessment point, colored as in A. Each point represents an independent experiment. Black bars indicate average value and standard deviations. Brackets indicate comparisons for unpaired two-tailed homoscedastic student’s t-tests (n.s. p > 0.05, **** p < 0.0001). (C) Addition of glycerol affects growth kinetics, but other sample manipulations, including electroporation, do not. Growth kinetics as assessed by confluency, colored as in A. The averages and standard deviations of three independent experiments are indicated by circles and error bars, respectively. The best fit to a sigmoid is indicated in solid lines and the 95% confidence interval by the shaded area. (D) DNP enhancement and (E) average TB,on values from saturation recovery experiments for all biomass components, protein (green), nucleotide (blue) and lipid (pink), are dependent upon the AMUPol concentration at the time of electroporation; the AMUPol concentration inside the rotor is estimated to be an order of magnitude lower than the AMUPol concentration at the time of electroporation. Error bars indicate standard deviations of the measurements.
