Figure 2:
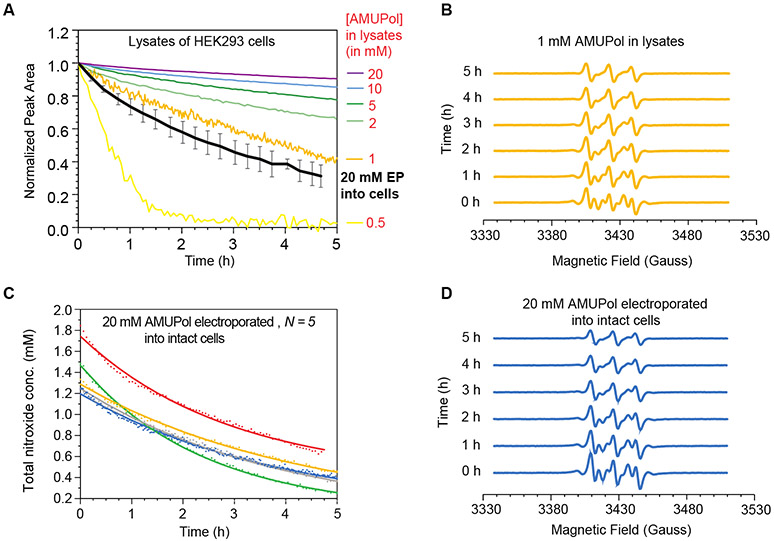
Deactivation kinetics of AMUPol in HEK293 cells. (A). Reduction kinetics of AMUPol in cellular lysates. The average AMUPol reduction rate for intact cells (black) is plotted for comparison. Error bars are the standard deviation of 5 replicates from part C. (B) EPR spectral changes over the time course of the reduction reaction for cell lysates with 1 mM AMUPol. (C) Reduction kinetics of AMUPol inside intact HEK293 cells. AMUPol was introduced by electroporation of cells in the presence of 20 mM AMUPol, followed by a 10-minute room temperature recovery period. After recovery, extracellular AMUPol was removed and EPR measurement began. Total nitroxide concentration determined by double integration of the EPR spectra is indicated by dots and lines indicate best fit to an exponential decay. Each biological replicate is plotted in a different color. The concentration AMUPol delivered to cells was about an order of magnitude lower than the concentration present in the buffer at the time of electroporation as expected. (D) EPR spectral changes over the time course of the AMUPol reduction reaction in intact cells. Displayed are the individual spectra from the time course depicted in blue in C.

