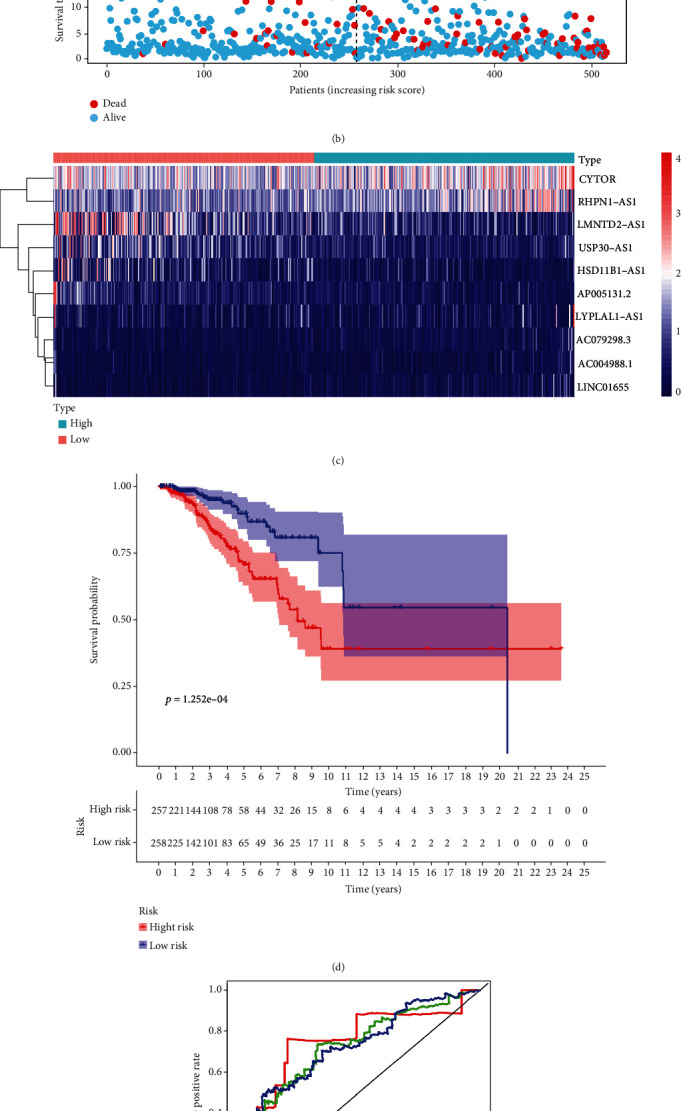
Figure 2.

Prognostic value of the risk patterns of the 10 ferroptosis-related lncRNAs in the TCGA-BRCA training set. (a) Distribution of ferroptosis-related lncRNA model-based risk score. (b) Different patterns of survival status and survival time between the high- and low-risk groups. (c) Clustering analysis heat map shows the expression standards of the 10 prognostic lncRNAs for each patient. (d) Kaplan-Meier survival curves of the OS of patients in the high- and low-risk groups. (e) The AUC values of the patients' 1-, 3-, and 5-year survival rate.
