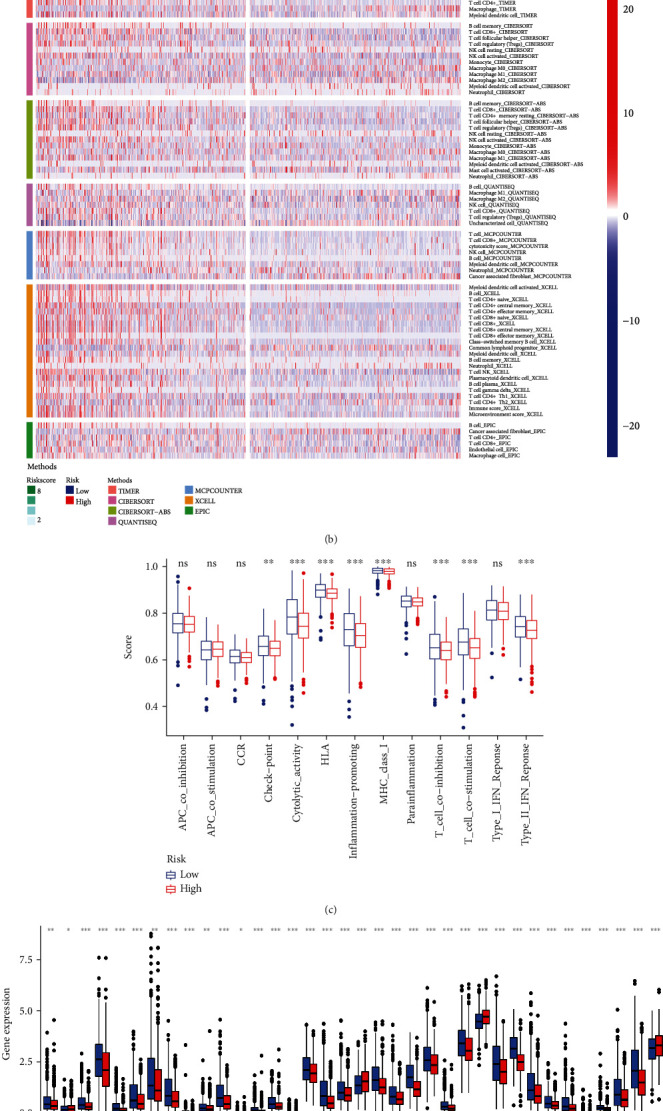
Figure 5.

Estimation of the tumor-infiltrating immune cells, immunosuppressive molecules, and cancer immunotherapy response using the ferroptosis-related lncRNA model in the TCGA-BRCA entire set. (a) Patients in the low-risk group were more positively associated with tumor-infiltrating immune cells such as B cells, CD8+ T cells, and CD4+ T cells as shown by Spearman correlation analysis. (b) The heat map of immune responses among the high-risk and low-risk groups based on ferroptosis-related lncRNA signatures. (c) ssGSEA for the association between immune cell subpopulations and related functions. (d) Expression of immune checkpoints among the high and low BC risk groups. (e–h) IPS comparison between the low-risk groups and the high-risk groups in the TCGA-BRCA entire set in the CTLA4 negative/positive or PD-1 negative/positive groups. CTLA4_positive or PD1_positive represented anti-CTLA4 or anti-PD-1/PD-L1 therapy, respectively (all p < 0.001).
