Figure 8.

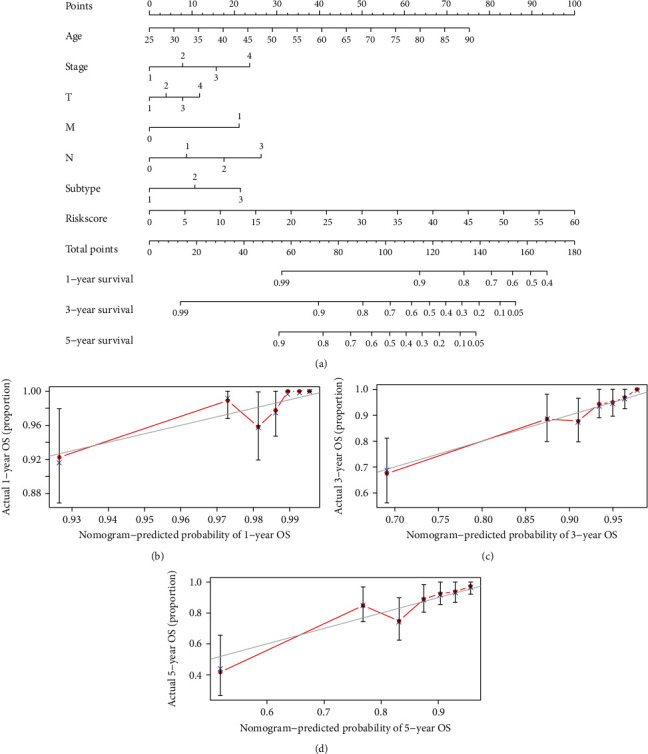
Construction and evaluation of a prognostic nomogram. (a) The nomogram predicts the probability of the 1-, 3-, and 5-year OS. (b–d) The calibration plot of the nomogram predicts the probability of the 1-, 3-, and 5-year OS.

Construction and evaluation of a prognostic nomogram. (a) The nomogram predicts the probability of the 1-, 3-, and 5-year OS. (b–d) The calibration plot of the nomogram predicts the probability of the 1-, 3-, and 5-year OS.