Figure 3.

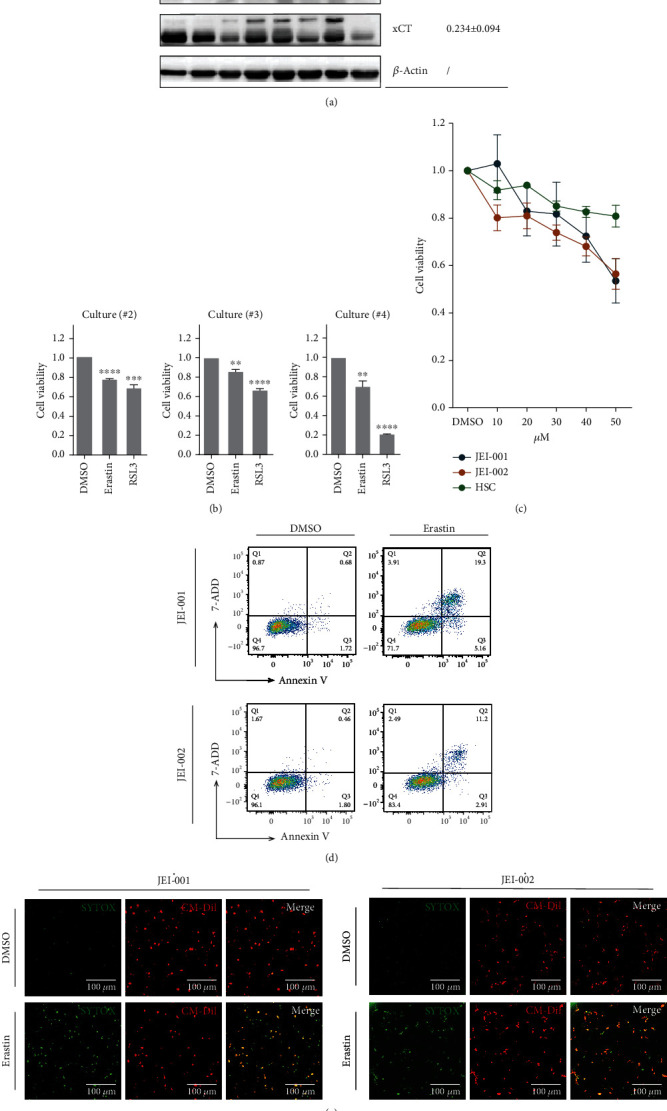
Erastin induced growth inhibition in schwannoma cells. (a) Three proteins in different individuals were evaluated by western blot (left panel). The relative average gray scale values were presented (right panel). (b) The viabilities of schwannoma primary cultures were incubated with erastin at 50 μM and RSL3 at 20 μm for 24 h. ∗∗p < 0.005. (c) The cell viability was measured by CCK-8. The cell viability of DMSO (solvent for erastin) was set as the reference. Triplicate in each group (p < 0.01). (d) After treatment with 50 μM erastin for 24 h. Cells were sampled for staining with annexin-V and 7-AAD and then examined via flow cytometry. (e) Different schwannoma cell lines were cocultured with erastin (50 μM) for 24 h. Dead cells were labeled by SYTOX Green and living cells were labeled by CM Dil (scale bar = 100 μm).
