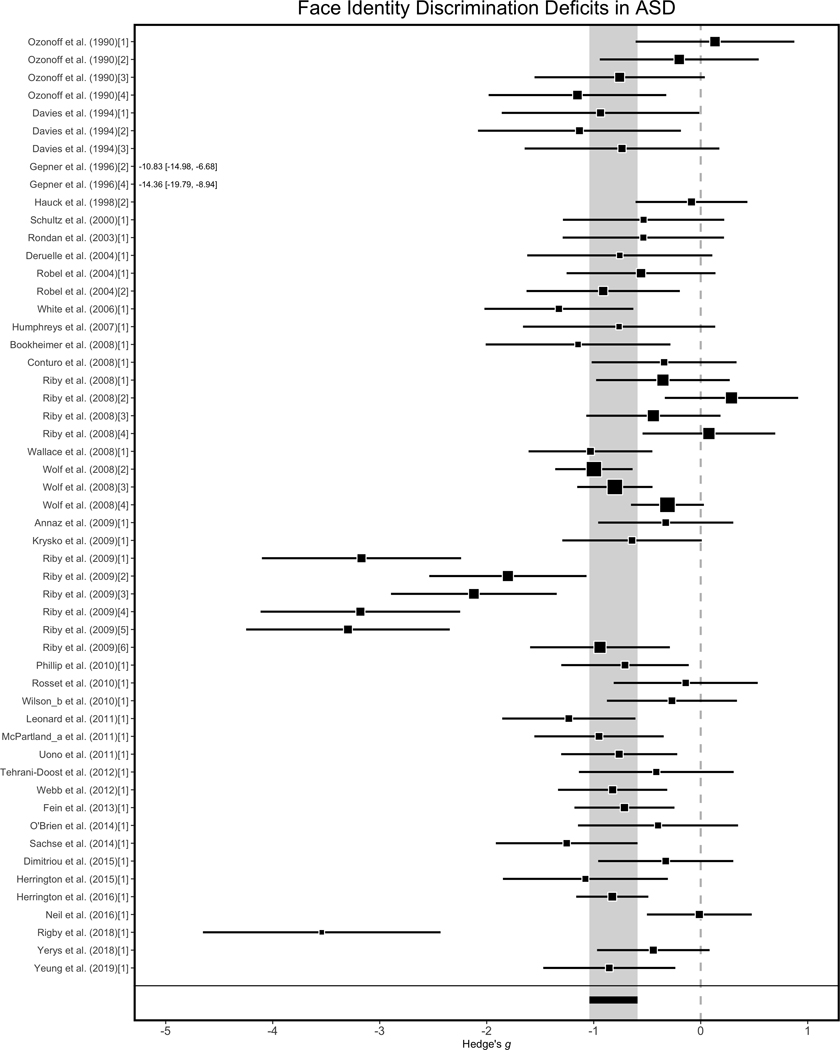
Figure 3.
Illustration of individual study and summary effect sizes for face identity discrimination tasks. Forest plots containing the standardized effect size estimate (square) and 95% confidence intervals (black bar) for each effect size in the meta-analysis plotted as a function of study year and alphabetically within study year. Nested effect sizes within a study are numbered in brackets. The summary effect size is presented at the bottom in black and the grey bar extending across all studies reflects the full 95% confidence interval around the summary effect size. For effect sizes less than −5, numerical values reflect the respective Hedge’s g and 95% CI values.

