Figure E.1.

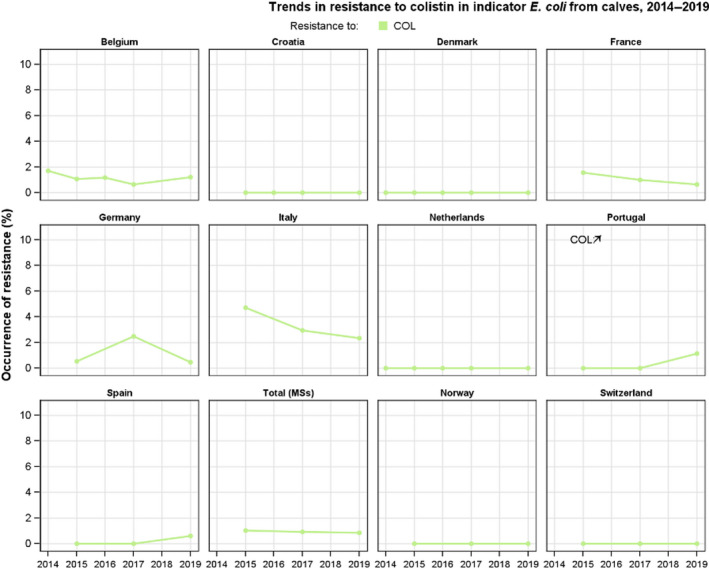
Temporal trends in resistance to colistin in indicator E. coli from calves under 1 year of age, 2014–2019 (nine MSs, two non‐MSs). Statistically significant increase (↑) or decrease (↓) indicated (p ≤ 0.05)

Temporal trends in resistance to colistin in indicator E. coli from calves under 1 year of age, 2014–2019 (nine MSs, two non‐MSs). Statistically significant increase (↑) or decrease (↓) indicated (p ≤ 0.05)