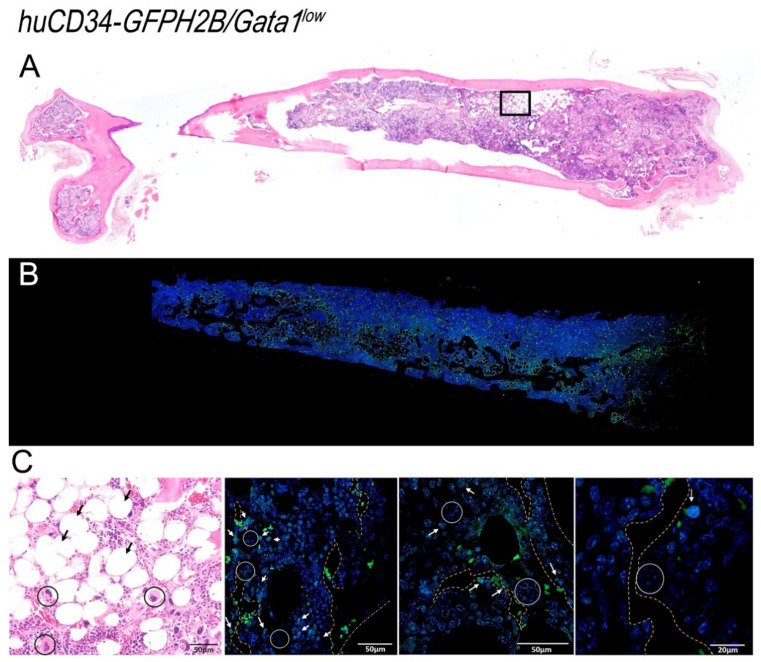
Figure 10.
Confocal microscopy analyses of the distribution of GFP-positive HSC within the bone marrow architecture of huCD34-GFPH2B/Gata1low mice. (A) H&E staining of a femur section from a representative huCD34-GFPH2B/Gata1low reveals hypocellular bone marrow with adipocyte hyperplasia associated with fibrosis and abundance of megakaryocytes. (B) Confocal microscopy analyses with GFP and DAPI of a femur section from one representative huCD34-GFPH2B mouse revealing that GFP+ cells are distributed both in the epiphysis and in the diaphysis of the femur. (C) Left panel: larger magnification of the rectangle in the H&E-stained section in A showing the great numbers of adipocytes (black arrows) and megakaryocytes (circles) present in the femur of the mutant mice. Other panels: larger magnifications of the confocal microscopy analyses of the femur shown in B indicating the localization of the GFP+ cells within the bone marrow architecture. White arrows indicate GFP-positive cells, circles indicate megakaryocyte clusters, and white dashed lines indicate the contour of microvessels, while yellow dashed lines indicate the contour of the neoformed bones. A and B are a photo-merge of 4× magnification pictures; in C, the magnifications are 20× for the first and second panel, 40× for the third panel, and 60× for the fourth panel.

