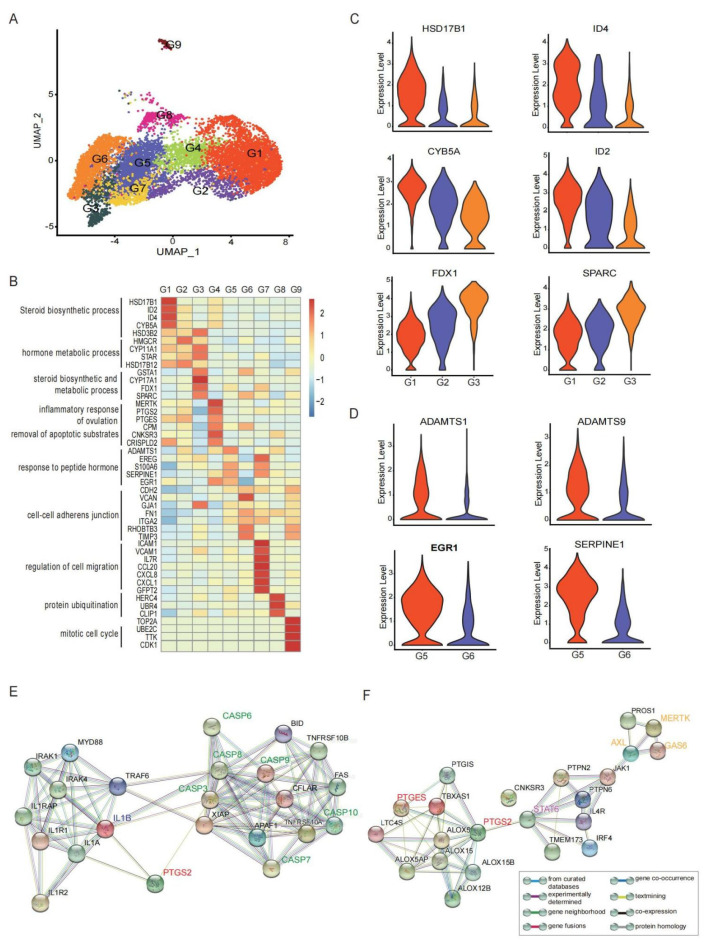
Figure 2.
The ScRNA profile and different functional clusters of GCs in preovulatory follicles. (A) Nine different clusters (G1–G9) identified in the GC population, shown in a UMAP plot. (B) Heat map showing the expression levels of major differentially expressed genes (DEGs) in the nine GC clusters. (C) Violin plots showing the expression levels of major DEGs in clusters involved in the steroid synthesis and metabolism (G1–G3). (D) Violin plots showing the expression levels of major DEGs in GC cluster 5 and cluster 6. (E) Protein–protein interaction network of PTGS2, IL1B and CAPSs. (F) Protein–protein interaction network of PTGS2, STAT6 and MERTK.

