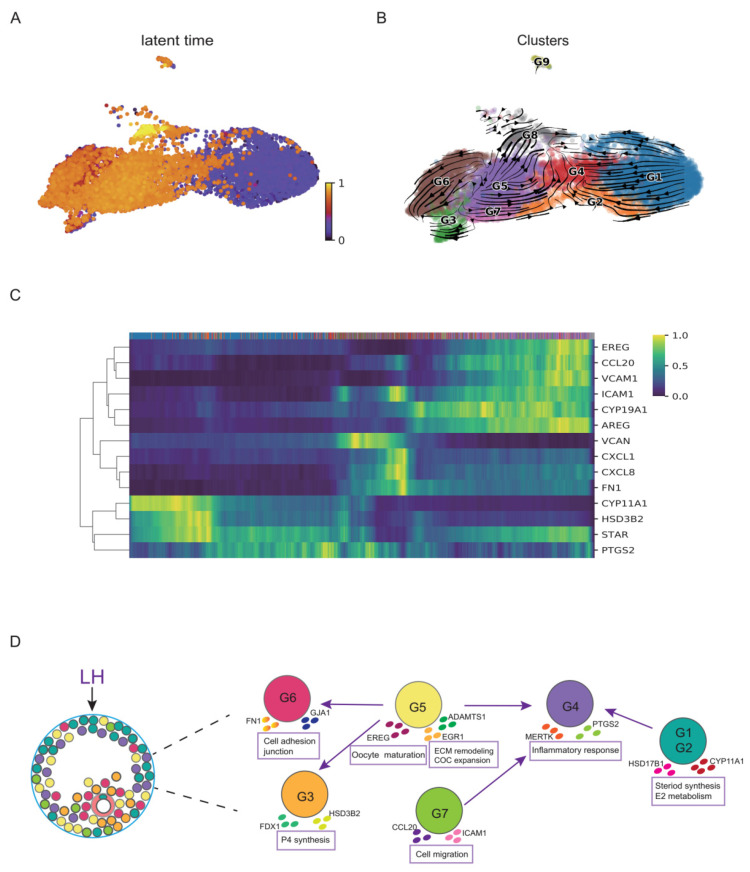
Figure 3.
The RNA velocity and trajectory analyses of GCs. (A) Latent time in the RNA velocity analysis projected on the UMAP plot of the nine GC clusters. (B) RNA velocity analysis result of the GC clusters. Arrows show the direction of development. (C) The moments of spliced abundances of critical genes in GCs along the latent time, with a gradient from blue to yellow indicating the lowest to the highest normalized spliced abundance. (D) Diagram of the developmental dynamics of the major clusters of GCs.

