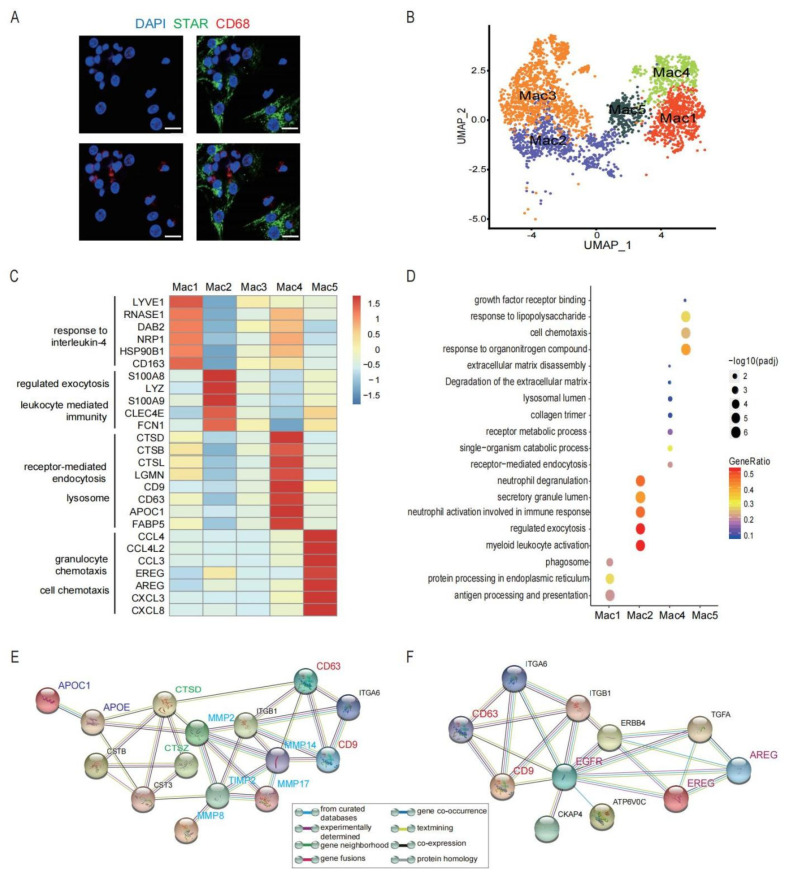
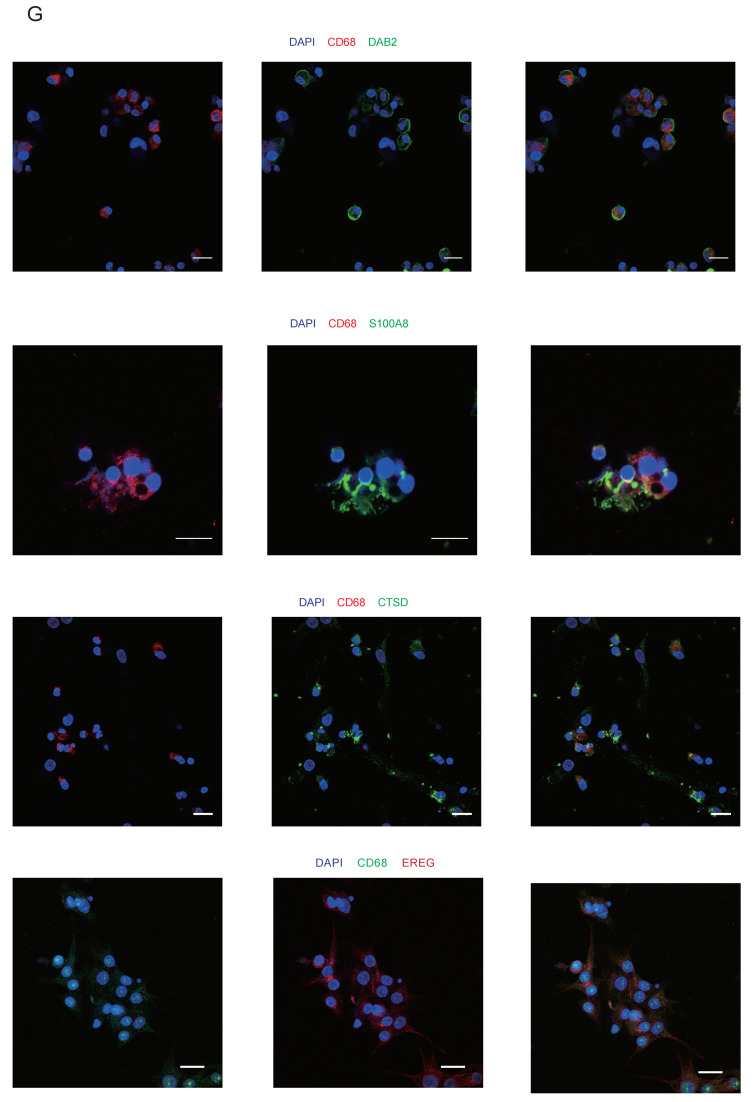
Figure 5.
Five functionally different clusters identified in macrophages in preovulatory follicles. (A) Immunofluorescence showing the existence of GCs (STAR, green) and macrophages (CD68, red) in preovulatory follicles. DAPI (blue)-labelled cell nucleus. Scale bar, 20 um. (B) Five different clusters (M1–M5) identified in the macrophage population, shown in a UMAP. (C) Heat map showing the expression levels of major DEGs in the five macrophage clusters. (D) Bubble plot showing the representative GO terms enriched in the five macrophage clusters. (E) Protein–protein interaction network of CD9, CD63, CTSs and MMPs. (F) Protein–protein interaction network of EREG, AREG, CD9 and CD63. (G) Immunofluorescence showing EREG protein expression (red) in macrophages in preovulatory follicles. CD68 fluorescence (green)-labelled macrophages, and DAPI (blue)-labelled cell nuclei. Scale bar, 25 um. Immunofluorescence showing DAB2, S100A8, and CTSD protein expression (green) in macrophages in preovulatory follicles. CD68 fluorescence (red)-labelled macrophages, and DAPI (blue)-labelled cell nuclei. Scale bar, 20 um.


