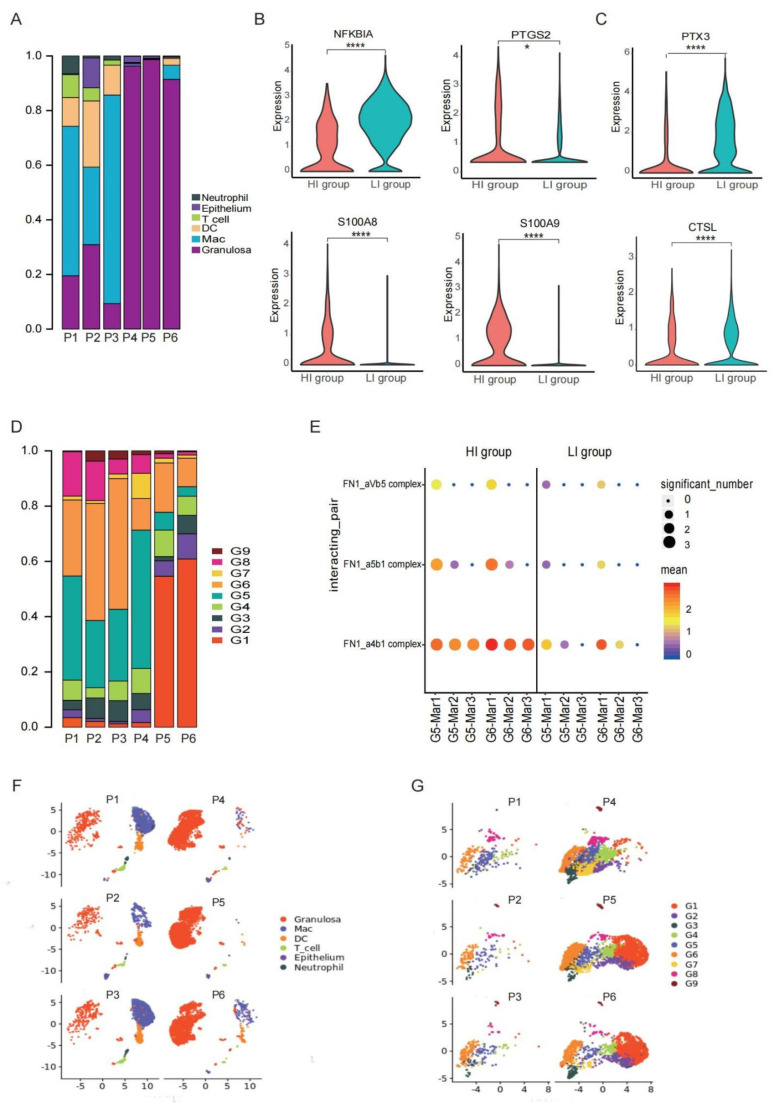
Figure 6.
Intrinsic heterogeneity in preovulatory follicles. (A) Cell type compositions in each of the six preovulatory follicle samples. (B) Violin plots showing the expression levels of NFkBIA, PTGS2, S100A8 and S100A9 in GCs of the HI and LI groups. **** p < 0.0001 and * p < 0.05 (Wilcox test). (C) Violin plots showing the expression levels of PTX3 and CTSL in GCs of the HI and LI groups. **** p < 0.0001 (Wilcox test). (D) Stacked bar graph showing the composition of GCs in each sample. (E) Bubble plot showing the ligand-receptor interactions mediated by adhesive molecules between GCs and macrophages in the HI and LI groups. (F) UMAP plot showing the individual distribution of all cells. (G) UMAP plot showing the individual distribution of all GCs.

