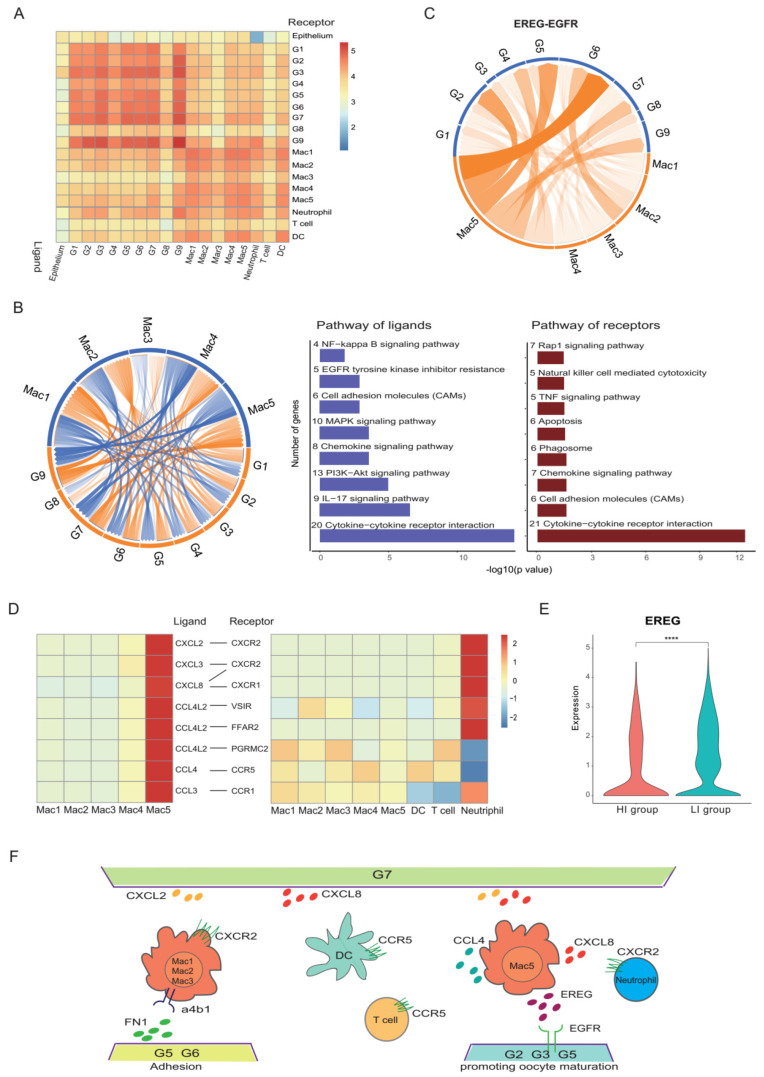
Figure 7.
Cell-cell interactions in preovulatory follicles. (A) Heat map showing the interactions between different cell types. (B) Circos plot showing the interactions between GCs and macrophages (left). The ligand–receptor interaction pathway of GCs and macrophages (right). (C) Circos plot showing the interactions between EREG on macrophage clusters (orange) and EGFR on GC clusters (blue). The thickness and darkness of the connecting lines in the middle of the circle indicate the prevalence of the interaction in the six samples. (D) Heat map showing the chemokine interactions between macrophages, DCs, T cells and neutrophils. (E) Violin plots showing the expression levels of EREG in the GCs of the HI and LI groups. **** p < 0.0001 (Wilcox test). (F) Diagram of the main ligand and receptors’ interaction of GCs and immune cells.

