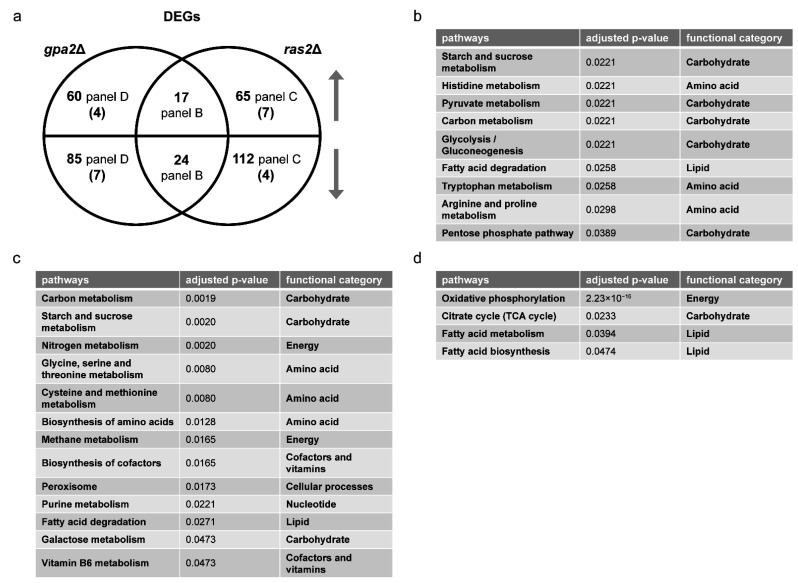
Figure 5.
Comparing differentially expressed genes (DEGs) of gpa2Δ and ras2Δ. (a) Venn diagram of subsets of DEGs, for gpa2Δ vs. wildtype and ras2Δ vs. wildtype, after glucose addition to 2%. Upper semicircle shows up-regulated DEGs and lower semicircle shows down-regulated DEGs. Numbers in the overlapping region are shared DEGs regulated in the same direction. Numbers in parenthesis are shared DEGs regulated in the opposite direction, and are placed in the area corresponding to the direction of regulation. DEGs used for ORA analysis that are (b) shared and change in the same direction; (c) unique to ras2Δ; (d) unique to gpa2Δ. Listed are all pathways and their functional categories with adjusted p-value < 0.05.

