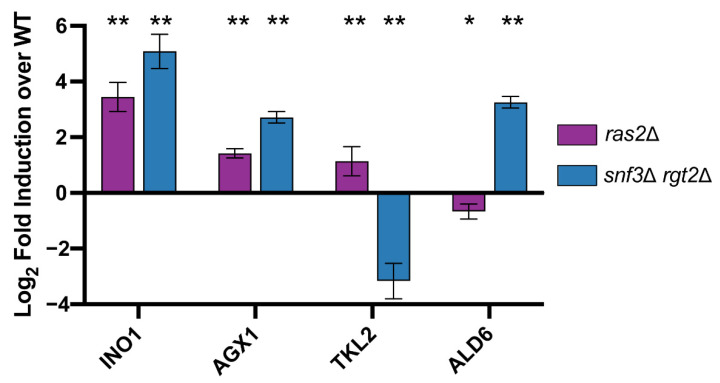
Figure 10.
qPCR analysis. Bar plots of qPCR data for INO1, AGX1, TKL2, and ALD6 for ras2Δ (purple) and snf3Δ rgt2Δ (blue). The X-axis shows target genes; Y-axis shows log2 fold induction relative to wildtype. Error bars represent standard error of mean and significance marks are as follows: p < 0.01(**), p < 0.05(*) as determined via Mann–Whitney U test and adjusted for multiple comparisons with the Benjamini–Hochberg procedure (see Methods).

