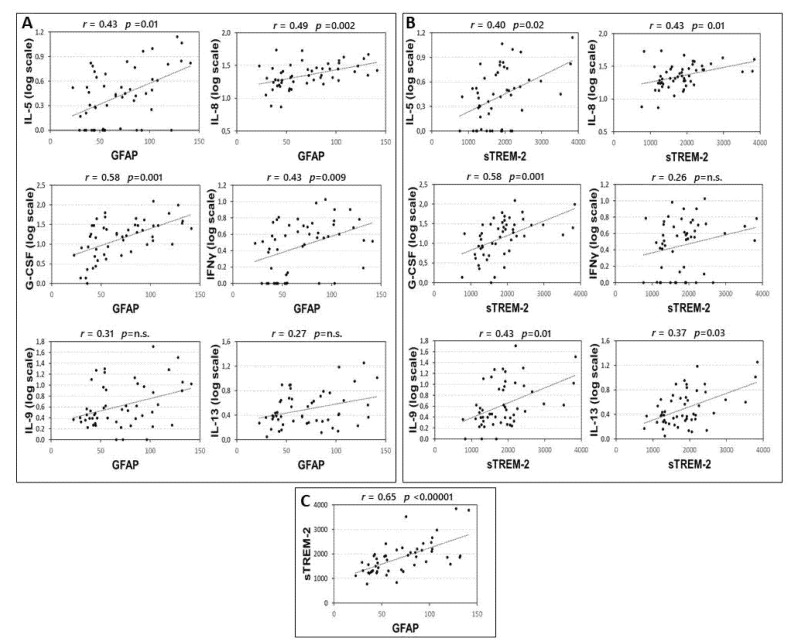
Figure 1.
Correlation between CSF levels of GFAP, TREM-2 and inflammatory cytokines. Spearman’s correlations between CSF levels of GFAP and cytokines (A), sTREM2 and cytokines (B) and GFAP and sTREM2 (C). p-value is shown according to Benjamini-Hochberg (B-H) correction. Median concentration (min-max), pg/mL, of IL-5: 1,74(0–12,85); IL-8: 21.23(6.38–53.60); GCS-F: 15.59 (0–122.70); INF-γ: 2.45 (0–9.66); IL-9: 2.20 (0–50.33), GFAP: 65.78 (22.72–141.44); sTREM-2: 1858.25 (767.08–3839.92). Abbreviations: Cerebrospinal fluid (CSF); glial fibrillary acidic protein (GFAP); soluble triggering receptor expressed on myeloid cells-2 (sTREM2); interleukin (IL); granulocyte colony stimulating factor (G-CSF); interferon gamma (INFγ); Spearman’s rho (r); B-H p-value (p).

