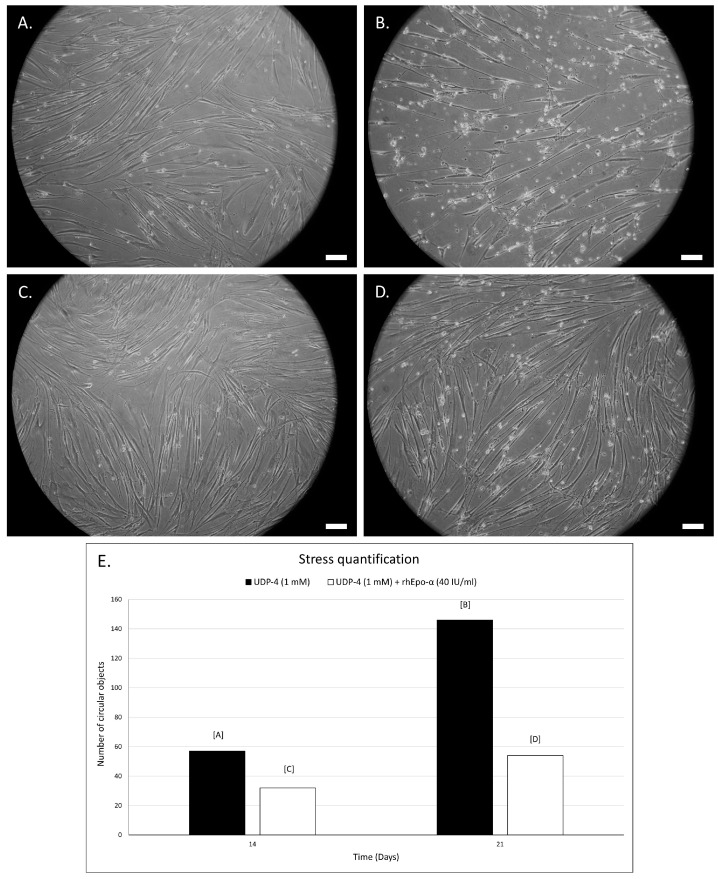
Figure 6.
Phase contrast microscopic images of SCAP treated with 1 mM of UDP-4 cultured for (A) 14 days and (B) 21 days showing decreased population and signs of cell stress. However, after washing-out UDP-4 after 7 days and treating cells with 40 IU/mL rhEPO-α for an additional (C) 7 days and (D) 14 days, cell density increases, whereas cell-stress signs decrease. (E) Quantification of cellular stress, by automatic detection of circular objects with ImageJ, shows strongly reduced stress after rhEPO-α treatment. Scale bars correspond to 50 µm.

