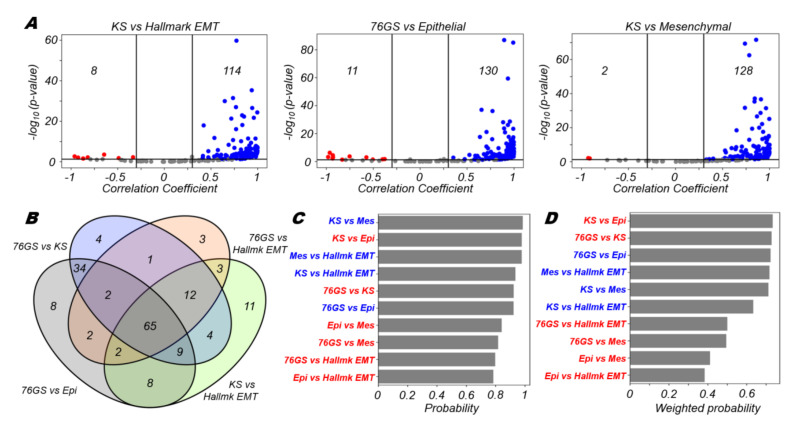
Figure 1.
Consistency between different EMT scoring metrics. (A) Volcano plots depicting the Pearson correlation coefficient and the −log10(p-value) for 3 pairs of EMT scoring metrics: KS vs Hallmark EMT, 76GS vs epithelial and KS vs mesenchymal. Vertical boundaries are set at correlation coefficients −0.3 and 0.3. The cut-off for p-value is set at 0.05. (B) Four-way Venn diagram for comparison of 4 representative pairs of EMT scoring metrics. (C) Probability of a dataset having a positive (blue) or a negative (red) correlation (correlation coefficient > 0.3) given that it is significant (p-value < 0.05) for different pairs of EMT scoring metrics. (D) Probability of a dataset having a positive (blue) or a negative (red) correlation (correlation coefficient > 0.3) given that it is significant (p-value < 0.05) weighted by the fraction of significant cases for different pairs of EMT scoring metrics.

