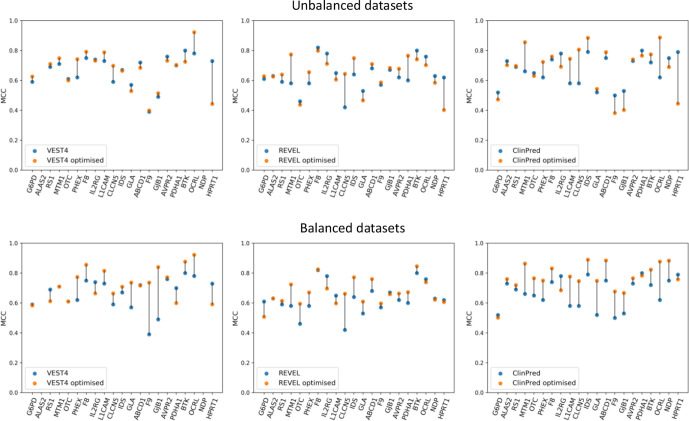
Figure 4.
A comparison of the default Matthews correlation coefficient (MCC) with the optimised MCC for the performance of VEST4, REVEL and ClinPred (left, middle and right panels, respectively) using all of the data sets (the top three panels) and using balanced data sets (the bottom three panels) for the 21 genes. For each gene, the data set was balanced using undersampling, that is, using a random subset from the majority class to match the number of variants in the minority class. The default MCC values were generated using the default threshold of 0.5. The optimised MCC values were generated using gene-specific thresholds. The gene-specific threshold was identified using 80% of all the predictions from each tool through repeated (n=10) fivefold cross-validation with random subsampling. The optimised MCC value was generated using the rest (20%) of the predictions from each tool at the threshold identified for each gene. VEST4 predictions were unavailable for ALAS2 and NDP variants in the respective transcripts of interest. The lines between the default MCC and the optimised MCC values for each gene are for visualisation purposes only.

