Figure 5.
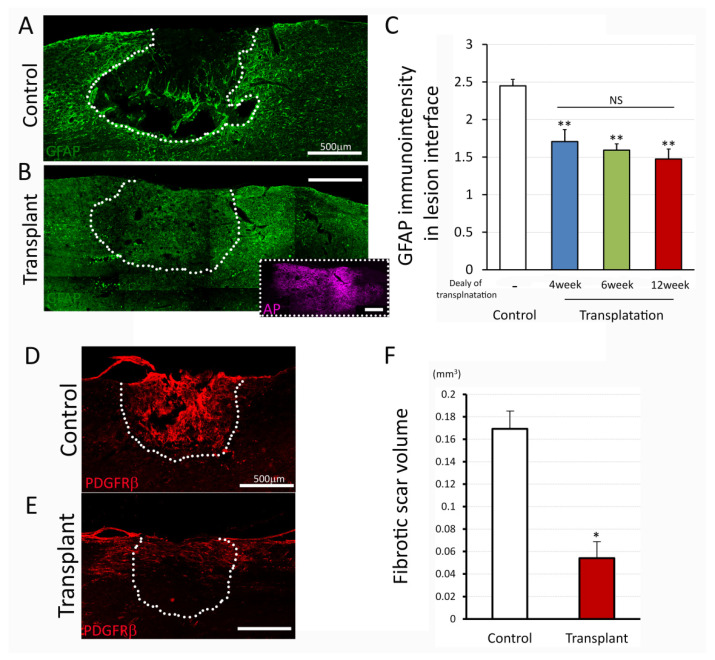
Glial and fibrotic scar after injury and dNPCs transplantation. (A–C) demonstrate GFAP immuno-intensity. Immunostaining represents the apparent GFAP-reactive boundary in control (A) and attenuation of immuno-intensity in the transplanted lesion interface at 5 weeks post transplantation (B). Quantitative analysis (C) shows significant attenuation of the GFAP immuno-intensity in three delay transplant groups compared to control group. Perivascular fibroblasts marker, PDGFRβ was used to estimate fibrotic scar volume (D–F). Immunostaining with PDGFRβ shows the fibrotic scar filled by the predominant PDGFRβ+ cells in the lesion site in control (D) and reduced immunoreactivity in transplant group (E) at 5 weeks post transplantation with delay of 12 weeks. Estimated fibrotic scar volume is shown in panel (F) with significant reduction of fibrotic scar in transplant group compared to control group. Data are presented as mean ± SEM. Statistical significance was set at p < 0.05 (C; one-way ANOVA with Bonferroni test, F; t-test). Asterisk indicates significant difference comparing to control (* p < 0.05, ** p < 0.005). NS: not significant. Scale bar = 500 µm. Lesion/transplant area is identified with a white dish-line.

