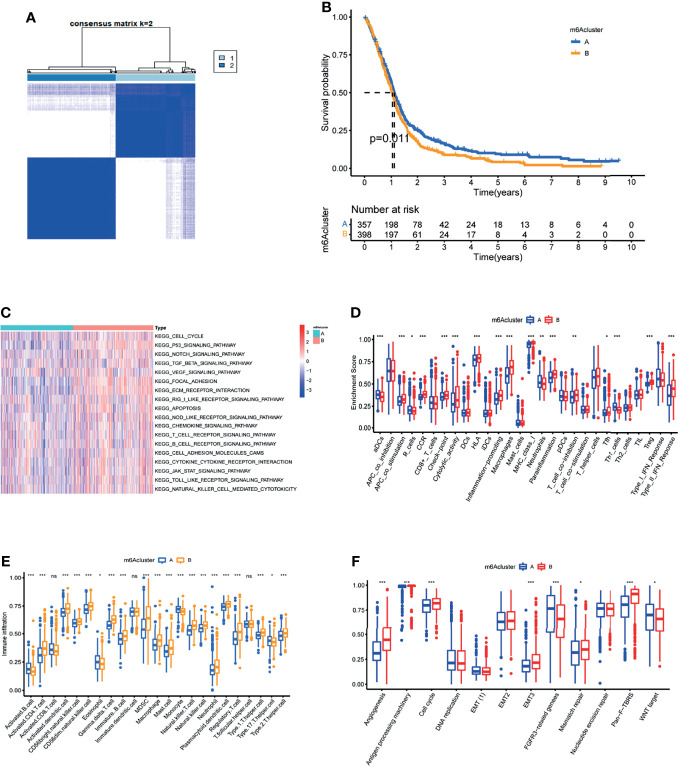
Figure 3.
Characterization of the tumor microenvironment in the two m6A methylation patterns. (A) Unsupervised clustering analysis in GBM meta cohort. (B) Kaplan-Meier OS analysis in the two m6A clusters. P = 0.011. (C) GSVA enrichment analysis in the two m6A clusters. Red indicates pathway activation. Blue indicates pathway inhibition. (D) Differential of immune function between the two m6A clusters. (E) Abundance of Immune cell abundance in the two m6A clusters. (F)Enrichment score of common stromal activation pathways in the two m6A clusters.*, **, and *** indicate p = < 0.05, < 0.01, and < 0.001, respectively. ns, not significant. Upper and lower ends of the boxes indicate interquartile range. The lines in the boxes represent the median values.

