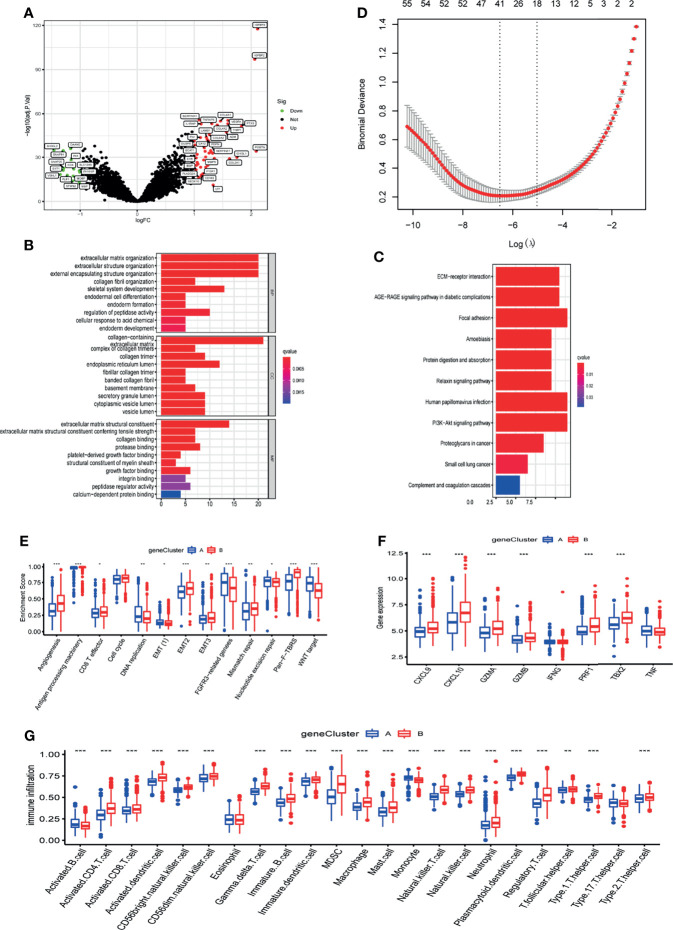
Figure 4.
Characteristics of m6A related phenotypes. (A) DEGs associated with the m6A phenotype. (B) GO enrichment analysis of differential genes (DEGs). (C) KEGG enrichment analysis of differential genes (DEGs). (D) Lasso analysis was used to obtain 41 signature genes of m6A methylation pattern. (E) The expression of common signatures in 2 m6A gene-clusters. (F) The expression of common immune activation genes in the 2 gene-clusters. (G) Abundance of Immune cell abundance in the 2 gene-clusters. *, **, and *** indicate p = < 0.05, < 0.01, and < 0.001, respectively.

