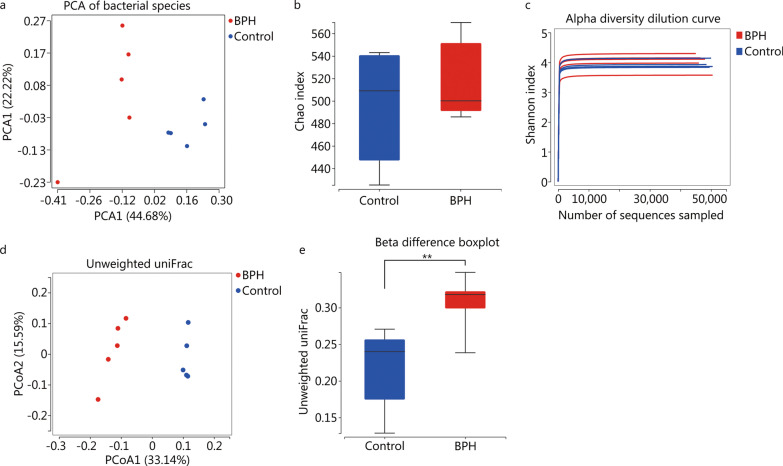
Fig. 2.
BPH affect inter-group diversity but not intra-group individual diversity. a Principal components analysis (PCA) of fecal microbiota from control and BPH group. b, c Box plots (Chao index) and dilution curve (Shannon index) show alpha diversity in gut microbiota of control and BPH rats, which reflect the richness and species diversity of each sample. Differences were assessed by non-parametric Wilcox test. d Principal coordinate analysis (PCoA) analysis of fecal microbiota from control and BPH based on unweighted UniFrac distance. The distinct clustering of samples was observed. The percentage of variation explained by PCoA1 and PCoA2 are noted in the axes. Groups are distinguished by colors. Each colored symbol corresponds to an individual sample. e Box plots showing beta diversity in fecal microbiota of control and BPH group (**P < 0.01). BPH: benign prostatic hyperplasia

