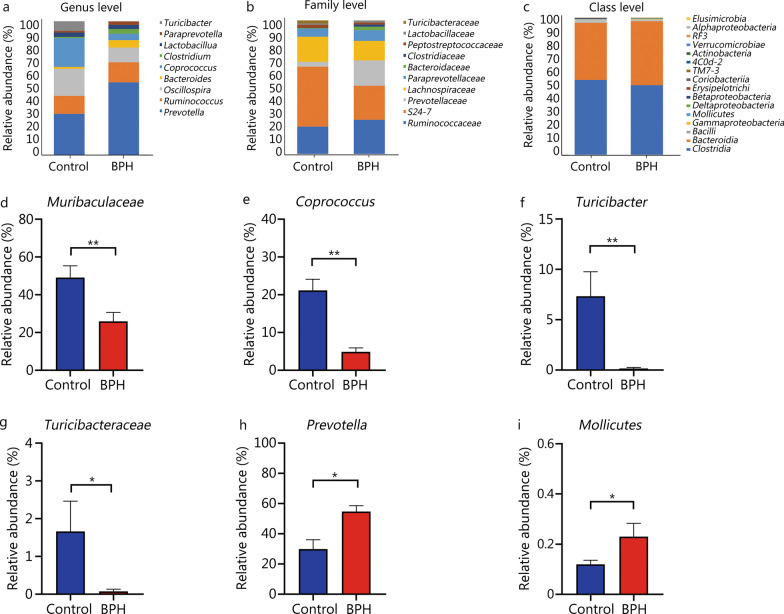
Fig. 3.
BPH altered the gut microbiota composition. Composition of fecal microbiome showing different communities at the genus (a), family (b) and class (c) level, different colors correspond to different species, and the color block length indicates the relative abundance of the species represented by the color. Relative abundance of (d) Muribaculaceae (family), e Coprococcus (genus), f Turicibacter (genus), g Turicibacteraceae (family), h Prevotella (genus), i Mollicutes (class). In (d–i) Mann–Whitney U test was used to determine statistically significant differences between the groups. Results are expressed as mean ± SEM, *P < 0.05; **P < 0.01. BPH: benign prostatic hyperplasia, OTUs: operational taxonomic units

