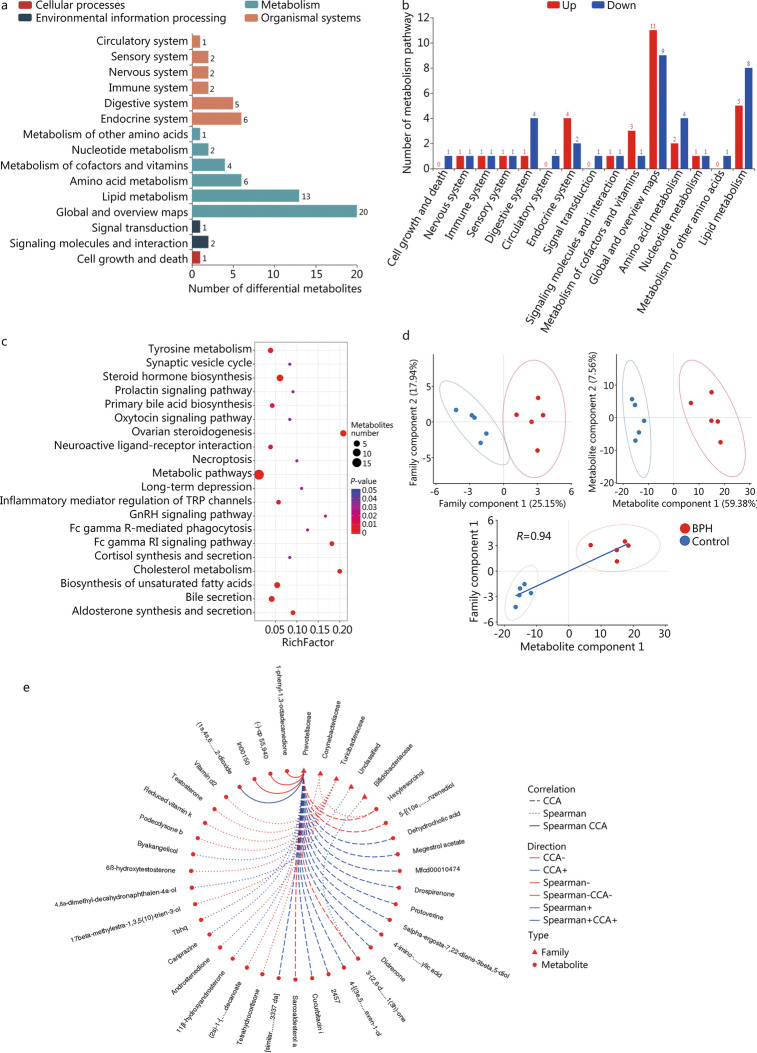
Fig. 6.
BPH leads to changes in metabolic pathways, which are related to changes in intestinal flora. a KEGG pathway function annotation bar graph of positive ion compounds: the X-axis represents the number of metabolite annotations, and the Y-axis represents the annotated KEGG pathway. b Statistical up-regulation and down-regulation of pathway classification of differential metabolites. c Bubble plots for metabolic pathway enrichment analysis: X-axis enrichment factor (RichFactor) is the number of differential metabolites annotated to the pathway divided by identified metabolites annotated to the pathway. The larger the value, the greater the proportion of differential metabolites annotated to the pathway. The dot size represents the number of differential metabolites annotated to this pathway. d Scatter plot of correlation between differential metabolites and microbial groups: (1) The component scatter plot of microbial group; (2) The component scatter diagram of differential metabolite; (3) Pearson correlation scatter diagram of the differential metabolite and the first component of microorganism group. The greater R is, the higher the degree of correlation between microorganism group and the first component of the metabolic pathway is. The color and ellipse represent sample groups. The greater the degree of sample dispersion in different groups, the better the classification effect of the component value. e Network diagram of correlation between differential metabolites and microbial groups at family level: the circle is the metabolite, the triangle is the microbial group; “ − ” represents negative correlation, “ + ” represents positive correlation. CCA: canonical correlation analysis, BPH: benign prostatic hyperplasia

