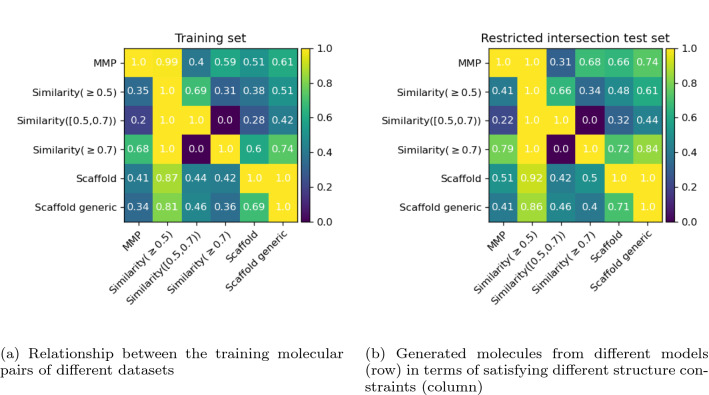
Fig. 5.
Comparison of heatmaps for training set and test set. The more similar, the better. a Relationship between the training molecular pairs of different datasets, e.g. the number 0.2 with Similarity ([0.5, 0.7)) as row and MMP as column from the training set represents 20% of the pairs with Similarity ([0.5, 0.7)) are also MMPs. b Each row represents the model trained on the corresponding dataset, and each column represents the corresponding structure constraints. The number 0.22 with Similarity ([0.5, 0.7)) as row and MMP as column from the Restricted intersection test set represents that when looking at the generated molecules using the Transformer model trained on Similarity ([0.5, 0.7)) dataset, among all the ones fulfilling the the property constraints and structure constraints (i.e. Similarity ([0.5, 0.7))), 22% of them are MMPs. The diagonal for the Restricted intersection is always 1 because we only look at the generated molecules that already fulfil the property constraints and structure constraints

